Danish Pig Research Centre Annual Report 2012: Nutrition 1
This section of the PRC annual report describes a new tool to formulate feed for finishers, revisions to the feeding standards, phytase equivalency, on-farm feed mixing and a comparison of different mills (hammer and disc types). 17 May 2013
 9 minute read
 By:
By: Diet of the Month
New tool for formulation of finisher feed
A current project under Pig Research Centre (PRC) called 'Diet of the Month', demonstrated that the cheapest standard diet is not necessarily the economically optimum diet. Feed prices and pig prices both influence the economically optimum amino acid level for finishers.
On the basis of multiple research activities with phosphorus, amino acid and crude protein, PRC determined dose response functions. With these, it is possible to estimate average daily gain, FCR and lean meat percentage for finishers independently of amino acids, phosphorus and crude protein levels. It is also possible to determine gross margin per place unit and livestock units with different calculation masks for lean meat percentage. When this information is combined with a feed formulation programme, feed can be formulated to maximum gross margin per place unit rather than simply the lowest price per FUgp.
The calculation mask is essential
Dose response functions show that low levels of protein and amino acids result in a poor lean meat percentage. However, a cheap diet - low in protein and amino acids - may in some cases lead to savings substantial enough to cover the reduced pig price caused by lean meat percentage. This depends to a large extent on the calculation mask used, though. If lean meat percentage is low, deductions from the pig price will be higher with the calculation mask of Tican and Danish Crown (DC) producers with a UK contract than the regular calculation mask of DC. It is therefore rarely profitable for suppliers to Tican and for producers with UK contracts to feed below the amino acid and crude protein standards.
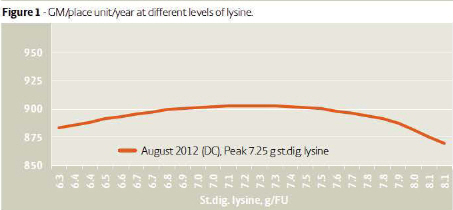
Feed formulations with the current prices and pig prices in August 2012 show that suppliers to DC can save approx DKK1 per place unit by feeding 7.2g st dig. lysine per FUgp (Figure 1), whereas suppliers to Tican need 7.6g lysine.
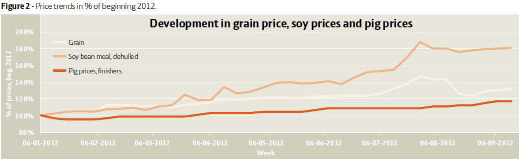
The ratio between grain prices, protein price and pig price affects the economically optimum amino acid content, and, as protein prices are currently soaring there may be some savings to be had (Figure 2).
Sound economy in standards
In the first half of 2012, grain prices increased -for periods of time - relatively more than soy prices. For a long period, there was consequently a benefit in "feeding above" the standard (7.6g lysine).
Looking at the average prices and pig prices in weeks 1 to 34 of 2012, it is clear that the best economy is obtained by feeding above the standard. However, considering the soaring protein prices of the last months, it seems that the average economically optimum content of amino acids and protein is close to the recommended standard.
The system is being tested by a group of pig advisers in 2012/2013, and the interface will subsequently be adjusted accordingly. The system will be available online at www.vsp.lf.dk
Pig Research Centre has constant focus on feed quality through:
- Revision of nutrient standards
- Updating of analysis values for ingredients
- Follow-up on the feed evaluation system
- Screenings for toxins in grain
Feed Quality
New standards
Amino acid standards for weaners were revised in April 2012 (brief no. 1207). The new standards are based on an economic optimum and on a desire to reduce treatments for diarrhoea triggered by high-protein feed. Standards for lysine as well as ideal protein were revised along with a few more revisions:
- Weight intervals for weaners
- Phase-feeding standards for finishers were adjusted
- The standard for vitamin E is reported in international units (IU).
The revised standards are available in Danish and English online at www.vsp.lf.dk.
Phytase
Together with scientists at Aarhus University, Pig Research Centre investigated the effect of increasing inclusion of three phytase products to establish how many phytase units of a given product are required to obtain identical effects. Results revealed that 500 units Phyzyme XP phytase or 1,250 units Ronozyme-NP phytase were required to replace 500 units Natuphos phytase – these inclusion rates are defined as '100 per cent inclusion'.
Results also demonstrated that the same response can be expected if the inclusion is changed, i.e. the same effect is expected if the inclusion of these three phytase products is doubled.
I factor / EDOMi
A comprehensive analysis was made on four laboratories concerning determination of energy in feed. Additivity (the calculation of energy in a purchased diet based on analyses of ingredients in proportion to analyses of energy in purchased diets) was also analysed. Results revealed good additivity across laboratories for feed units in purchased feed.
The I factor, which is the relation between EDOMi and EDOM (I factor = EDOMi × 100 ÷ EDOM), can be determined for ingredients and purchased feed on the basis of multiple analyses of EDOM and EDOMi values of the ingredients. It has been decided to apply the I factor in the Feedstuff control rather than EDOMi. Both methods produce the same analysis accuracy for energy concentration. The feedstuff table available at www.vsp.lf.dk is recommended for control of declared I factors in purchased diets.
The project was fnancially supported by the EU and the Rural District Programme under the Danish Ministry of Food, Agriculture & Fisheries. Journal no. 3663-D-09-00354.
Energy in purchased feed
Pig Research Centre analysed correspondence between the declared and the analysed levels of feed units (FU) in 59 samples of purchased feed from four large feedstuff producers. Results showed that the analysed level was close to the declared level.
Results showed that ATR, Danish Agro and HEDEGAARD agro varied in terms of excess as well as deficiency compared with the declared level, whereas DLG had most samples with fewer FU than declared. Analysed feed units were significantly fewer in the samples from DLG than declared. The largest variations in energy – positive as well as negative – were found in the samples from Danish Agro. This investigation was conducted as a spot check, and is therefore not necessarily representative of these companies over a longer period of time.
The project was fnancially supported by the EU and the Rural District Pro- gramme under the Danish Ministry of Food, Agriculture & Fisheries. Journal no. 3663-D-10-00460.
Ochratoxins
The 2011 harvest was extremely wet. In March/April 2012, samples of grain were collected from pig producers who harvested wet grain and stored the grain themselves for feeding purposes. Analyses revealed a very low prevalence of the toxin ochratoxin A. Some samples had a water content above 16 per cent. This means that the grain is not sufficiently dry for storage unless you keep a close eye on grain temperature and subsequently aerate the grain.
The wet harvest in 2011 generally did not cause problems with high contents of ochratoxin A.
Slaughter data from before and after the 2011 harvest reveal no increase in the occurrence of porcine nephropathy (kidney failure), which is triggered by feed with a high content of ochratoxin A. The occurrence of porcine nephropathy is stable and low. This corresponds with the low findings in grain.

On-farm Mixing of Feed
In cooperation with the local pig advisers participating in UVS, Pig Research Centre has developed a new management tool for pig producers who mix their feed on-farm
Management of on-farm mixing
Management of on-farm mixing is a tool to help the pig producer ensure that their on-farm mixing system is running efficiently. It consists of 25 factsheets describing the most essential processes in feed production - from ingredients to the finished diet. It also includes a range of check lists and work plans that can be tailored to each farm to assist in the organizing of everyday routines. It is best to start using the tool together with an adviser who is also an expert in this area.
An expert group consisting of eight local pig advisers and three employees from Pig Research Centre ensures that qualified advice is available for pig producers and that the tool is further developed.
Mini user guides were made in cooperation with producers of on-farm mixing equipment (Big Dutchman, Skiold and ACO Funki) covering the most common feed computers. The mini user guides describe the most frequently used 67 functions.
Management of on-farm mixing is currently being tested by the expert group in cooperation with 11 pig producers across the country.

The project was financially supported by the EU and the Rural District Programme under the Danish Ministry of Food, Agriculture & Fisheries. Journal no. 3663 D 11 00509.
Grinding of grain
In cooperation with energy suppliers, EnergiMidt A/S and EnergiNord A/S, Pig Research Centre tested six feed mills for on-farm mixers. The investigation comprised hammer mills from Skiold, President, Moderne Kornbehandling, Øgendahl and Big Dutchman, and one disc mill from Skiold.
All mills were tested with barley (fine, medium and coarse grinding) and wheat sufficiently dry for storage (fine grinding only). The companies installed the mills that were equipped with 22-kW motors.
All mills fulfilled the requirement for fine grinding and only small differences in energy consumption and capacity were observed between the mills. The disc mill from Skiold was found to have the lowest energy consumption at fine grinding while at medium and coarse grinding of barley, energy consumption was largely identical with that of the hammer mills.
At fine grinding, hammer mills used on average 1.03kWh per 100kg wheat and averagely 1.53kWh per 100kg barley This demonstrates that it requires approx 50 per cent more energy to grind barley than wheat. Mill capacity at fine grinding averaged 2,600kg per hour for wheat and 1,800kg per hour for barley.
With these three levels of grinding of barley, 56 per cent, 63 per cent and 84 per cent, respectively, of the ground particles had a particle size be low 1mm. Energy consumption increased on average 0.24kWh per 100kg barley when the percentage of particles below 1mm increased by 10 percentage units. At the same time, mill capacity dropped by 400kg per hour, which further increased the overall energy consumption as trough augers, elevators, grain cleaning equipment and mixer must operate correspondingly longer in the feed barn.
Based on the outcome of this study, the increased energy use required for fine grinding is estimated to constitute approximately 10 per cent of the overall saving in feed consumption. It is still recommended that grain mixed on farm be ground sufficiently fine to achieve a good FCR without being so fine that gastric changes reach unacceptably high levels.

The project was financially supported by the EU and the Rural District Pro gramme under the Danish Ministry of Food, Agriculture & Fisheries. Journal no. 32101 U 12 00195.
May 2013