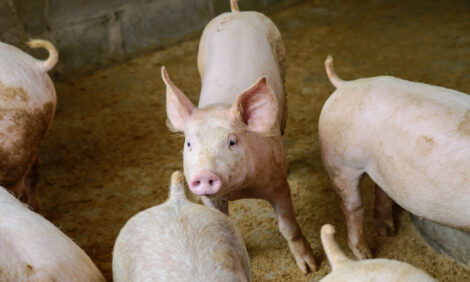


CME: No Reductions in Breeding and Market Herds
US - According to CME's Daily Livestock Report for 25 June, many observers of what a journalist called “the hog mess“ in a phone call this week may be wondering just why the much discussed pre-report expectations do not indicate more reductions in US swine breeding and market herds.For reasons that we think you will see momentarily, we begin our discussion of the subject with the chart below. Recall that, according to Iowa State University’s Estimated Costs and Returns, in August 2007 the US pork industry had just enjoyed its longest string of profitable months ever. Iowa farrow-to-finish operations, on average, made money for 35 straight months from February 2004 through December 2006. After a loss of $0.60/head on sales in January 2007, these operations returned to profitability for another 8 months before losses began in October 2007. That’s 43 of 44 months profitable at an average rate of just under $20/head. Producers, to say the least, became quite well-healed with some having no operating debt and very little long term debt and the entire segment reaching an estimated 75-80 per cent equity. Bankers could find very few who needed to borrow money.

Since then, to use a baseball analogy, producers are batting 0.100 — 2 for 20. And as can be seen
from the chart, the two “hits“ they did get last summer were the equivalent of bloop singles Three
other months might be classified as infield outs but the rest of the months since September 2007 have been
strike-outs –perhaps not of producers doing but strikeouts nonetheless. (We apologize now to our international
readers since we have no idea how to make a soccer/football/futbol analogy for this situation. Bu we may learn
after the US’s stunning upset of world #1 Spain on Wednesday — aren’t you impressed that we even KNEW
about that?) . But we digress.
The string of profitable months explains a great deal of US producers’ delay in reducing output — they
had money and they thought they could weather the financial storm, especially after exports in 2008 caused the
storm to lull, providing what in hindsight appears to be a very false sense of security. In addition, Lean Hogs
futures spent much of the past 4 years constantly telling producers that prices were going to get better. And
many producers took advantage of those higher futures prices to avoid much of the cash market losses depicted
in the chart above. Another reason for the here-to-fore lack of action.
But the two events at right now demand action. The top graph (similar to one used in the June 10 edition
of DLR) shows the dramatic jump in slaughter of US born pigs in the fall of 2007. It coincides perfectly with
the introduction of circovirus vaccines in the summer of 2007. The 11.9 per cent figure represents the difference of the
average for Q4-2007 to date versus Q4-2003 through Q3-2007. The bottom graph shows the almostsimultaneous
increase in production costs, driven primarily by the increased use of corn for ethanol. The average
breakeven cost in the ISU estimates for 2007 to date is $69.56/cwt. carcass weight, 30.7 per cent higher than the
average of $53.22/cwt carcass for 1998 through 2006.

Producers’ response through March had been to reduce the breeding by only 3.6 per cent — nowhere near enough to offset the downward pressure of more pigs on prices and the need, whose long-term status is now clear, for higher prices to cover higher costs. It may not have started by 1 June but it is likely underway now.


