

CME: A Glimpse into Livestock Slaughter Stats
US - As we wait for the cattle on feed and cold storage reports that will come out this afternoon, we thought it would be worthwhile to wait a bit and see what the livestock slaughter statistics would show (released 8.30 am), write Steve Meyer and Len Steiner.Below are some of our observations:
- Total US commercial cattle slaughter in May was 2.876 million
head, 2 per cent larger than a year ago. But we had an extra
slaughter day this year. When adjusted for that (i.e. you look at
implied daily slaughter), daily cattle slaughter for the month was
actually 2.6 per cent lower than a year ago. Indeed, daily cattle slaughter
has been posting year over year declines since September 2011.
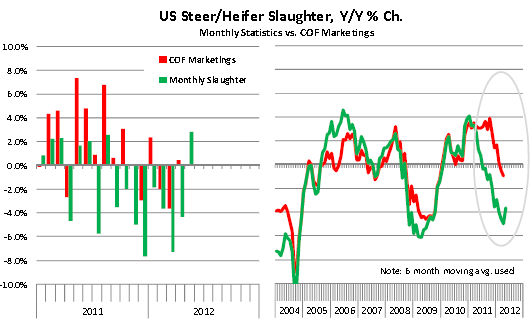
- Steer slaughter in May was up 4 per cent from a year ago while heifer slaughter increased just 0.5 per cent from last year. Combined steer and heifer slaughter for the month was 2.8 per cent larger than last year. Note that extra slaughter day, however. One issue that we have mentioned a number of times before is the continuing divergence between the slaughter data as reported in the monthly statistics and the marketings as reported in the cattle on feed report. The charts show the divergence in these numbers in 2011 and 2012 (slaughter has been much smaller than marketings). We also show how these two statistics have tracked since 2004. Because of the monthly variations we used a six month moving average to eliminate some of the noise in the long term chart. It is important to keep this in mind when looking at the cattle on feed marketings that will be published this afternoon. As to why the numbers are different, it appears that there have been notable changes in industry structure. The monthly cattle on feed survey reports only on feedlots that have capacity of +1000 head. As smaller feedlots close or merge to create larger operations, this tends to skew the year over year comparisons (i.e. the pool of operations surveyed this year is larger than a year ago). This also has implications when you look at the total cattle on feed inventories. If the structural change theory is correct, and the data seems to support that, then inventory numbers may be tighter than the survey implies.

- Commercial hog slaughter in May was 9.285 million head,
8.7 per cent larger than a year ago. When adjusting for the extra
slaughter day, commercial slaughter in May was up 3.7 per cent from a
year ago. The monthly increase was quite significant and the largest
year over year increase since September 2008. The big increase
in slaughter combined with heavier weights to yield a 9.5 per cent increase
in total pork production. Indeed, at 1.927 billion pounds, this was the largest amount of pork ever produced for
the month of May.
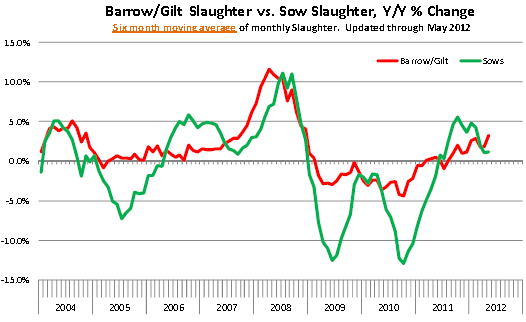
- The slaughter data also showed that sow slaughter in May was up 4.6 per cent from last year. Does this mean we are liquidating sows? Short answer is: not really. For the last three months (May, Apr, May) sow slaughter has been 728 ,000 head, compared to 742,500 head a year ago (-2 per cent). Lower sow slaughter and some gilt retention should help slowly increase the sow herd. But that can quickly change if the corn crop continues to deteriorate. So far, producers appear to be leaning toward modest expansion.


