

Hogs & Pigs Report Final Estimates Within Range of Expectations
US - On 27 December, USDA released the "Quarterly Hogs and Pigs Report" reporting inventories as of December 1, 2013. These quarterly reports are usually highly anticipated by market participants as they provide key data for estimating hog supplies, writes Lee Schulz.Also, these reports give an indication as to what producers intend to do in the next few quarters. Given the host of issues facing the hog industry this report was much anticipated and will be dissected and debated for weeks if not months to come. Pending the report, there were broad expectations that: i) market hog inventory would be slightly lower than a year ago, attributed primarily to lower year over year pipeline pig supplies, ii) breeding herd inventory would show some form of expansion, iii) Porcine Epidemic Diarrhea Virus (PEDv) impacted the number of pigs per litter and reduced productivity during the Sep-Nov period, and iv) farrowing intentions for Dec-Feb 2013/14 and Mar-May 2014 would show the potential for solid growth with improved margins, realized and forward, having a big impact on the profitability picture. Most final estimates were within the range of pre-report expectations with one major exception (namely, the breeding herd inventory being down 1.1 per cent from a year ago) generally suggesting 2014 hog supplies may be even tighter than previously believed.
US Hogs and Pigs
Revisions were made to past inventory estimates to bring them in line with final pig crop, official slaughter, death loss, and updated import and export data. Specifically, USDA revised its estimates of the Dec-Feb 2012/13 and Mar-May 2013 pig crop. This was widely expected given the slaughter numbers reported this fall. USDA lowered their previous estimate of the Dec-Feb 2012/13 sows farrowing by 56,000 head and lowered their estimate of the Mar-May 2013 sows farrowing by 105,000 head. The pigs per litter estimates for these two periods remained the same. This resulted in the Dec-Feb 2012/13 pig crop decreasing by 563,000 head and the Mar-May 2013 pig crop decreasing by 1,085,000 head. The take-home contribution of these revisions is that previous USDA estimates of the Dec-Feb 2012/13 and Mar-May 2013 pig crops under-estimated the size of the breeding herd liquidation in the latter part of 2012.
Table 1 provides a summary of the 1 December 2013 hogs and pigs estimates for the US. The US total hogs and pigs inventory, at 65.940 million head, was 0.7 per cent below a year ago. The total market hog inventory was down 0.6 per cent at 60.183 million head and the breeding herd inventory, at 5.757 million head, was down 1.1 per cent. Pre-report estimates pegged the breeding herd inventory at 1.1 per cent (between 0.2 per cent and 1.9 per cent) above a year ago. The decline in the kept for breeding inventory of 1.1 per cent indicates that there has been no expansion and in fact some liquidation. This decline comes at a time when sow and gilt slaughter has been lower and thought to be low enough to suggest growth. Through the first 50 weeks of 2013 sow slaughter has been 3.1 per cent below 2012 and 9.1 per cent below the 2007-11 average. Sow slaughter has been down significantly since the beginning of July, a time of year in which sow slaughter is typically trending upward. Since July sow slaughter has been 7.0 per cent below 2012 and 10.5 per cent below the 2007-11 average. In addition, according to University of Missouri data, gilt slaughter year to date has been 2.0 per cent below year ago levels.
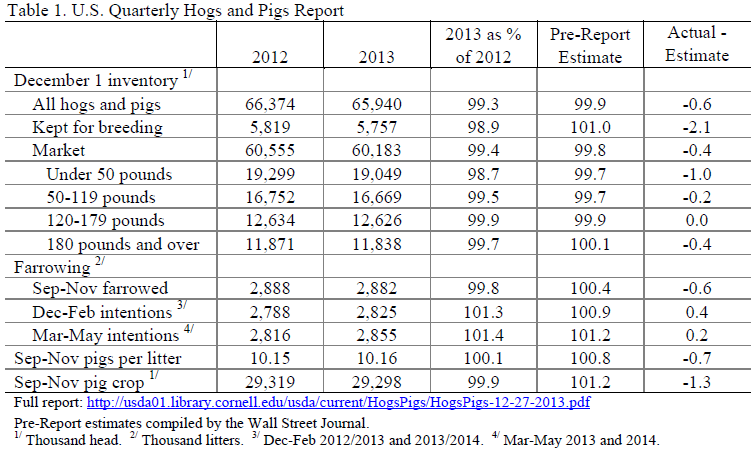
The inventory of pigs less than 50 pounds, at 19.049 million head, was down 1.3 per cent and the inventory of pigs 50 to 119 pounds, at 16.669 million head, was down 0.5 per cent. Pig inventory weighing 120 to 179 pounds, at 12.626 million head, was down 0.1 per cent while inventory weighing 180 pounds and over, at 11.838 million head, was down 0.3 per cent. Market participants were watching these categories closely for an indication of the impact from PEDv with many analysts expecting year over year declines. This was second report following the outbreak and spread of PEDv in the US and corresponded closely to the period when the market would see the wide-spread impact of the disease.
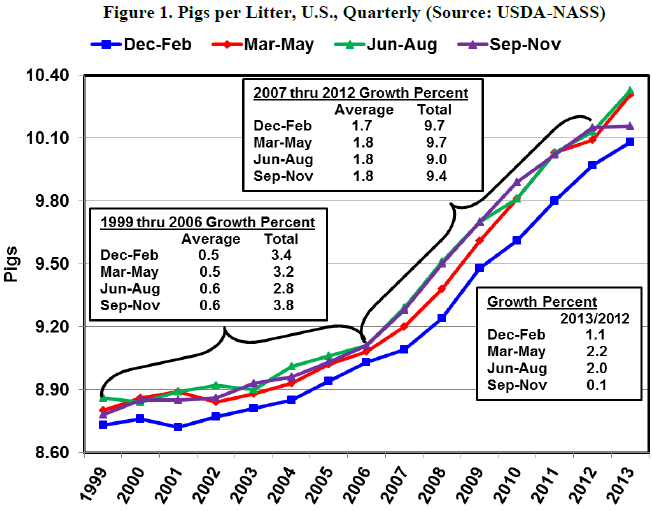
Sep-Nov sows farrowing, at 2.882 million head, was down 0.2 per cent. The Sep-Nov pigs per litter, at 10.16 pigs, was up only a modest 0.1 per cent compared to a year ago (figure 1). The Sep-Nov pig crop, at 29.298 million head, was down 0.1 per cent. This was still the fourth largest Sep-Nov pig crop in the history of the data going back to 1974.
The outlook for hog supplies in 2014 will be affected by producer intentions to farrow sows in the coming months. Dec-Feb 2013/14 sows farrowing, at 2.825 million head, would be up 1.3 per cent compared to a year ago and Mar-May 2014 sows farrowing, at 2.855 million head, would be up 1.4 per cent. This is somewhat perplexing as a smaller breeding herd would correspond to fewer sows farrowing. Lower feed costs and the potential for strong and sustained profits this next year will likely encourage producers to maximize sows farrowing but the initial farrowing intention estimates may be too optimistic given the size of the breeding herd. And, if growth in pigs per litter remains relatively flat as was experienced this last quarter, there could be very limited growth in the pig crops in the upcoming quarters.
Iowa Hogs and Pigs
USDA revised its estimates of the Dec-Feb 2012/13 and Mar-May 2013 pig crop for Iowa. USDA lowered their previous estimate of the Dec-Feb 2012/13 sows farrowing by 10,000 head and lowered their estimate of the Mar-May 2013 sows farrowing by 20,000 head. The pigs per litter estimates for these two periods remained the same. This resulted in the Dec-Feb 2012/13 pig crop decreasing by 103,000 head and the Mar-May 2013 pig crop decreasing by 210,000 head.
Table 2 provides a summary of the 1 December 2013 hogs and pigs estimates for Iowa. The total hogs and pigs inventory, at 20.500 million head, was 0.5 per cent below a year ago. The total market hog inventory was down 0.2 per cent at 19.530 million head and the breeding herd inventory, at 0.970 million head, was down 5.8 per cent. This was the smallest Iowa December 1 breeding hog inventory in the history of the data going back to 1963. The 5.8 per cent decrease from a year ago represents the largest year over year decrease since the 7.9 per cent decrease in 1999.
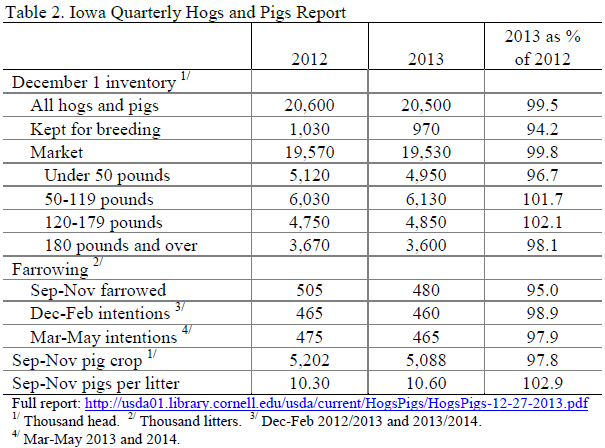
The inventory of pigs less than 50 pounds, at 4.950 million head, was down 3.3 per cent while the inventory of pigs 50 to 119 pounds, at 6.130 million head, was up 1.7 per cent. Pig inventory weighing 120 to 179 pounds, at 4.850 million head, was up 2.1 per cent while inventory weighing 180 pounds and over, at 3.600 million head, was down 1.9 per cent.
Sep-Nov sows farrowing, at 0.480 million head, was down 5.0 per cent. The Sep-Nov pigs per litter, at 10.60 pigs, was up 2.9 per cent compared to a year ago (figure 2). The Sep-Nov pig crop, at 5.088 million head, was down 3.2 per cent. Producers in Iowa continued to realize tremendous progress in productivity, i.e., pigs per litter. In fact, the Sep-Nov pigs per litter tied the record high of 10.60. This is a bit surprising when considering the flat-line growth reported by the aggregate US estimates.
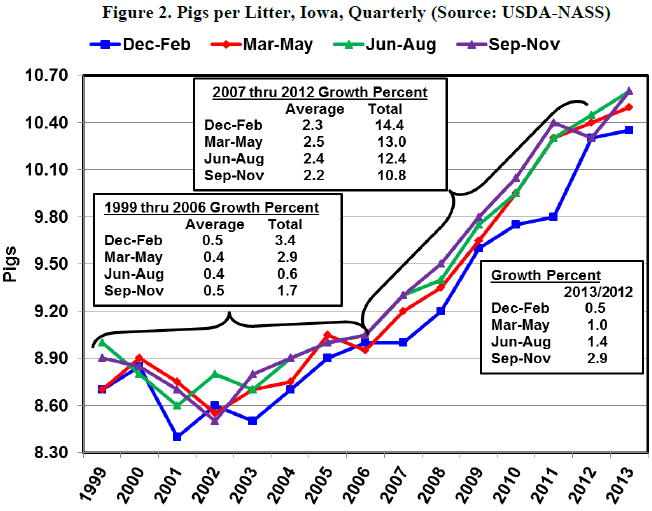
Producer intentions in Iowa to farrow sows in the coming months is considerably more pessimistic than is the case for the US Dec-Feb 2013/14 sows farrowing, at 0.460 million head, would be down 1.1 per cent compared to a year ago and Mar-May 2014 sows farrowing, at 0.465 million head, would be down 2.1 per cent. These farrowing intentions align with the current size of the breeding herd, i.e., smaller breeding herd corresponds to fewer sows farrowing. However, if growth in pigs per litter remains strong as was experienced this last quarter, the decrease in pig crops could be limited in the upcoming quarters.
Commercial Hog Slaughter Projections and Lean Hog Price Forecasts
Table 3 contains the Iowa State University price forecasts for the next four quarters and the quarterly average futures prices based on 30 December 2013 settlement prices. The futures price forecasts are adjusted for a historic Iowa/Southern Minnesota basis. The table also contains the projected year over year changes in commercial hog slaughter.


