Hog Slaughter Numbers Slide But Export Data Offer Good News
US - US federally-inspected slaughter declined by another three million head last week but was “only“ 3.2 per cent lower than one year ago, writes Steve Meyer for the National Hog Farmer. 8 April 2014
 4 minute read
 By:
By: We put “only” in quotes for two reasons. First, it is a pretty large number to be considered small but must be considered so when compared to recent weeks of six and seven per cent year-on-year reductions.
On the other hand, I use “only” as irony in that last week’s slaughter was smaller than last year’s total even though last year’s figure included a light (290,000 head) Monday run because it was the day after Easter and some plants were closed. Part of that short day was, of course, offset by a larger Saturday total but the point is that a “normal” week this year was even smaller than a holiday-impacted week last year. Just think of how that comparison will go in two weeks when this year’s Easter-impacted week is compared to last year.
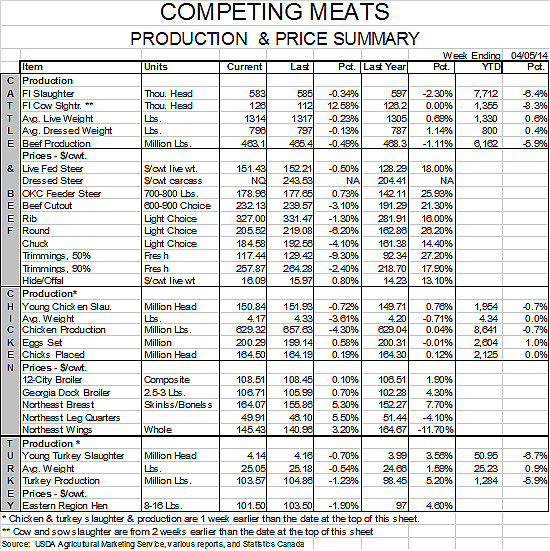
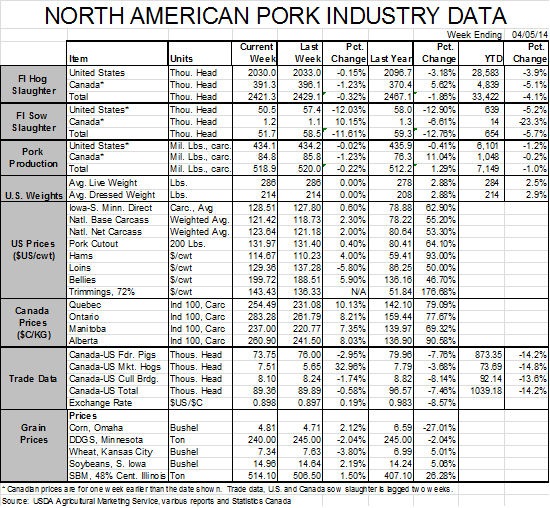
US hog weights made up for almost the entire shortfall in slaughter last week leaving production only fractionally lower. Based on daily data from USDA, US slaughter is now down 3.94 per cent for the year and production is down 1.2 per cent. The weekly data we use for the Weekly Preview data tables shows combined US-Canadian output down a very similar 1 per cent for the year.
Last week saw a sizeable dose of cold water poured on the red-hot Lean Hogs futures market. I wasn’t surprised by that as those prices had gone far beyond what even my bullish supply computations had suggested. I was surprised it took the market so long last week to move lower given the USDA Hogs and Pigs report estimates but a substantial reduction in cutout value and cash hog prices on Thursday apparently brought some people back to reality; whatever that may be in the hog supply situation.
February brings good export news
Thursday also brought news of a good month for US pork exports. USDA’s Foreign Agricultural Service reported February exports were 6.6 per cent higher in product weight volume and 5.6 per cent higher in value. February is the second straight month of year-on-year improvement and leaves year-to-date product-weight exports up 5.6 per cent in volume and 4.8 per cent in value.
Note that for both February and year-to-date the value increases are smaller than the quantity increases, implying lower unit pricing. That will almost certainly change when the March data are released in early May given the explosion in US wholesale prices since March 1.
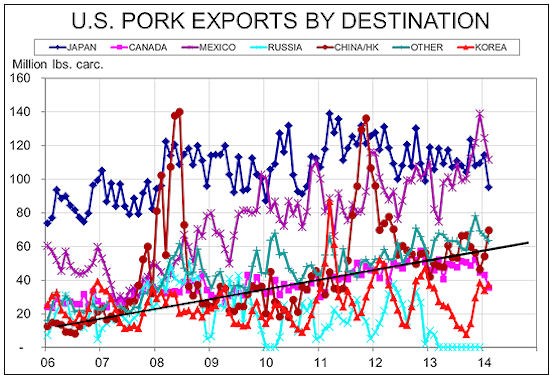
Figure 1 shows carcass weight equivalent data for top US markets from USDA’s Economic Research Service. Some notable features of the chart are:
- Mexico was the largest export market for muscle cuts for the fourth straight month. Though shipments were lower than in January, 36 per cent more US pork went south versus one year ago. YTD exports to Mexico are up 23 per cent. While higher prices may negatively impact this market when March data are published, PEDV has taken a toll on domestic Mexican supply as well, leaving Mexican buyers even more in need of US product.
- Shipments to China/Hong Kong surged in February to a level 40 per cent larger than last year, bringing year-to-date shipments 35 per cent higher versus 2013. The long-term growth trend for this market is still firmly intact. I still expect the Smithfield-Shuanghui merger to tilt this trend upward but I’m doubting whether it can happen this year given short US supplies, higher US prices and reports of sharply lower Chinese prices. One thing to consider: Perhaps the lower Chinese prices are due to lower demand for Chinese supply. A long history of poor food safety and outright adulteration may have taken its toll, leaving Chinese consumer demand for imported product strong.
- Exports to “Other” markets continue to increase at about the same rate as exports to China/Hong Kong. The markets are led by Australia (#6 ranking and up 10 per cent for the year), Phillipines (#7 ranking but down 29 per cent year-to-date) and Colombia (#8 ranking and up 179 per cent YTD). Honduras, Chile and Dominican Republic follow those. Note that all of these countries except Phillipines have been partners in bilateral trade agreements in recent years. I still expect the bilateral agreement with South Korea to yield similar results.
- Exports to Canada hit their lowest monthly level since early 2011. We believe the major driver of this decline is the weaker Canadian dollar which has been hovering around $0.90US since the first of the year. That is its weakest level since mid-2009 and effectively reverses one of (and, I believe the primary) driver of higher US exports north.
- More zeroes for Russia. And that will very likely continue given our frosty relationships at the moment. It may be for the better since US exporters should probably use limited supplies to take care of dependable customers.
Wednesday’s World Agricultural Supply and Demand Estimates will be, as usual, watched very closely by the grain trade. That attention will be more than normal, though, as this will mark USDA’s first 2014/15 supply and demand estimates for corn and soybeans. The supplies are pretty predictable give the Planting Intentions and trend yields. Usage, though, is another matter. What will USDA do with exports, ethanol and feed/residual for the new crop year? For that matter, what will USDA do with a feed/residual estimate for this year that still looks too large relative to animal numbers but might be small relative to March 1 grain stocks?
Finally, what will USDA say about US pork production, exports, etc. in those meat and poultry tables near the end of the report? The WASDE authors had done little to reflect PEDV prior to this month because other USDA agencies (most notably the National Agriculture Statistics Service (NASS)) had not weighed in on the issue. NASS did so with the Hogs and Pigs report and, even though it was bearish relative to futures markets, it did reflect sharply lower supplies that should be accounted for in this month’s supply and demand estimates.