

PED Hits US Pig Numbers, Output But Solid Growth Forecast
US - A summary of the June 'Hogs and Pigs' Report for the country as a whole and for the state of Iowa in 'Iowa Farm Outlook'.USDA’s June 'Hogs and Pigs' report confirmed what the industry had been suspecting for the past quarter — lingering impacts of the Porcine Epidemic Diarrhoea Virus (PEDv), according Lee Schultz in a report in the current 'Iowa Farm Outlook' from the Iowa State University's Department of Economics.
Coming into the report there were broad expectations that:
- Market hog inventory would be lower than a year ago, attributed primarily to lower year over year pipeline pig supplies,
- Breeding herd inventory would show some form of expansion as the profit margins seen so far in 2014 would be a driver of expansion
- PEDv had impacted the number of pigs per litter and reduced productivity during the March-May period, and
- Farrowing intentions for June-August 2014 and September-November 2014 would show the potential for solid growth.
Most final estimates fell well below pre-report expectations; generally suggesting 2014 hog supplies may be even tighter than previously believed. As such, the latest hogs and pigs report confirmed much of the recent run-up in lean hog futures prices.
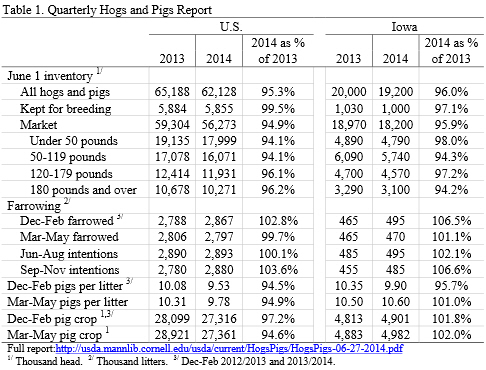
Table 1 provides a summary of the June 1, 2014 hogs and pigs estimates for the United States and Iowa. Revisions were made to past inventory estimates reported in the March 1, 2014 report to bring them in line with final pig crop, official slaughter, death loss, and updated import and export data. Specifically, USDA made an adjustment of 0.2 per cent for the U.S. to the June 2013 total hogs and pigs inventory, an adjustment of -0.4 per cent for the U.S. and-2.1 per cent for Iowa was made to the March-May 2013 pig crop, and an adjustment of -0.4 per cent for the U.S was made to the June-August 2013 pig crop. The most notable contribution of these revisions is that the previous estimate of the March-May 2013 pig crop was over-estimated. USDA lowered their previous estimate of the March-May sows farrowing by 10,000 head where the entirety of the decrease came in Iowa. The pigs per litter estimates for this period remained the same. This resulted in the March-May 2013 pig crop decreasing by 105,000 head.

US Hogs and Pigs
The US total hogs and pigs inventory, at 62.128 million head, was 4.7 per cent below a year ago. The total market hog inventory was down 5.1 per cent at 56.273million head and the breeding herd inventory, at 5.855 million head, was down 0.5 per cent. The decline in the kept for breeding inventory of 0.5 per cent indicates that there has been no expansion. This slight decline comes at a time when the net of sow and gilt slaughter has been lower and thought to be low enough to suggest growth. Through the first 24 weeks of 2014 sow slaughter has been 6.0 per cent below 2013 and 11.0 per cent below the 2008-12 average. According to University of Missouri data, gilt slaughter year to date has been 0.6 per cent above year ago levels. The slower than expected expansion is likely a result of the combination of hogs being hedged lower than the current cash market and the ongoing impacts of PEDv. Thereby, expansion has been limited as profits to fill the equity hole created over the last few years have not been filled as quickly as expected.
The inventory of pigs less than 50 pounds, at entory of pigs 50 to 119 pounds, at 16.071 million head, was down 5.9 per cent. Pig inventory weighing 120 to 179 pounds, at 11.931 million head, was down 3.9 per cent while inventory weighing 180 pounds and over, at 10.271 million head, was down 3.8 per cent. Overall, these pipe-line and near-market ready hog supplies are below what is likely currently priced into the market, especially weaned and feeder pig supplies, as analyst expected much smaller year over year declines
The March-May pigs saved per litter, at 9.78 pigs, was down 5.1 per cent compared to a year ago; following the downward trend of the Dec-Feb pigs per litter and further confirming PEDv’s impact on the industry. The March-May sows farrowing, at 2.797 million head, was down 0.3 per cent. Thus netting a 5.4 per cent decrease in the March-May pig crop.
June-August 2014 sows farrowing, at 2.893 million head, would be up 0.1 per cent compared to a year ago and September-November 2014 sows farrowing, at 2.880 million head, would be up 3.6 per cent. The potential for strong and sustained profits this next year and the opportunity to offset losses from PEDv continues to encourage producers to maximize sows farrowing but the initial farrowing intention estimates, especially the September-November 2014 estimate, may be too optimistic given the size of the breeding herd. And, if the number of pigs saved per litter continues to reflect a direct impact from PEDv as was experienced again this last quarter, there could be very limited growth potential in the pig crops in the upcoming quarters.
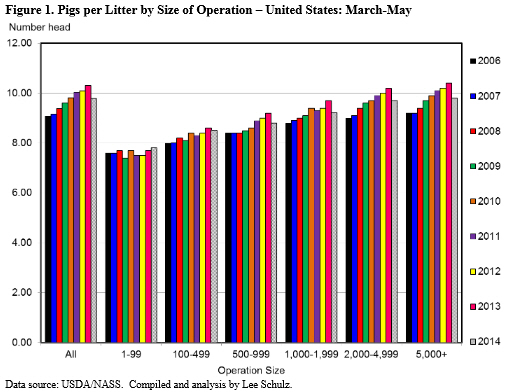
Figure 1 shows pigs per litter by herd size since 2006. The figure reveals three notable points:
- First, when compared with smaller operations, larger breeding operations perform markedly better by this productivity measure and also appear to have improved at a faster rate over time. That is, from 2006 to 2013 operations of 100-499 head have experienced 7.5 per cent growth in pigs per litter while operations of 5,000+ head have experienced 13.0 per cent growth.
- Secondly, so far as one can rely on these data, PEDv has set back productivity growth in this measure by four to five years, i.e., pigs per litter is currently at 2009-2010 levels.
- Third, the impact has not been uniform across scale of operation. The change in March-May pigs per litter from 2013 to 2014 is quite heterogeneous. For example, in operations of 100-499 head pigs per litter has decreased 1.2 per cent while in operations of 5,000+ the decrease has been about 5.8 per cent.

Iowa Hogs and Pigs
The total hogs and pigs inventory, at 19.200 million head, was 4.0 per cent below a year ago. The total market hog inventory was down 4.1 per cent at 18.200 million head and the breeding herd inventory, at 1.000 million head, was down 2.9 per cent.
The inventory of pigs less than 50 pounds, at 4.790 million head, was down 2.0 per cent while the inventory of pigs 50 to 119 pounds, at 5.740 million head, was down 5.7 per cent. Pig inventory weighing 120 to 179 pounds, at 4.570 million head, was down 2.8 per cent while inventory weighing 180 pounds and over, at 3.100 million head, was down 5.8 per cent.
The March-May pigs saved per litter, at 10.60 pigs, was up 1.0 per cent compared to a year ago. With the March-May sows farrowing at 470,000 head, being up 1.1 per cent, the pig crop for this period was up 2.0 per cent. With the considerable variability being reported in the pigs saved per litter, sows farrowing, and farrowing intentions and implications for pig crops it will be imperative to verify these numbers. The slaughter numbers are the best data we have and in coming reports USDA will go back and update, if needed, the pig crop numbers to match the slaughter data.
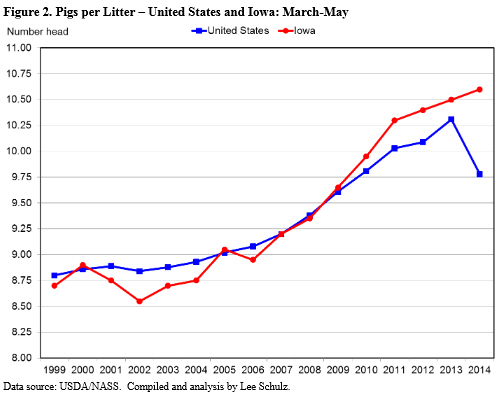
This last quarter, producers in Iowa realized progress in productivity, i.e. pigs per litter. In fact, the March-May pigs per litter of 10.60 was a record high for this period (Figure 2). This is a bit surprising when considering the decline reported by the aggregate U.S. estimate which can be directly attributed to the impact of PEDv.

Commercial Hog Slaughter Projections and Lean Hog Price Forecasts
Table 2 contains the Iowa State University price forecasts for the next four quarters and the quarterly average futures prices based on June 30, 2014 settlement prices. The futures price forecasts are adjusted for a historic Iowa/Southern Minnesota basis. The table also contains the projected year over year changes in commercial hog slaughter.

Taking the report as is, using pig crop numbers for December-February and March-May and farrowing intentions for June-August and September-November with commensurate pigs per litter to project supplies, one would expect hog slaughter in 2014.Q3 to be down about 4.76 per cent, 2014.Q4 slaughter to be down 5.39 per cent, 2015.Q1 slaughter to be down 3.52 per cent, and 2015.Q2 slaughter to be down 1.26 per cent compared to previous year levels.


