

CME: Hog Slaughter Down Last Week
US - Hog slaughter last week was 2.211 million head, 3.6 per cent lower than the previous week and 2.1 per cent lower than what it was a year ago.The slaughter level was lower than what was implied by the last USDA Hogs and Pigs report but it is too early to conclude that slaughter numbers are starting to deviate from the inventory survey. Hog slaughter so far has tracked quite close to the inventory implied numbers and, if that continues to hold, we should expect hog slaughter to hover a little under 2.3 million head for the next two weeks and remain above 2.2 million head
Total cattle slaughter last week at 534,000 head was 1.5 per cent higher than the same week a year ago. We do not have a breakdown of the steer, heifer and cow slaughter but can make a projection based on the data reported through Thursday and the Fri/Sat slaughter. We estimate steer/heifer slaughter for the week at 423,000 head, 1.6 per cent higher than a year ago.
Cow/bull slaughter for the week was an estimated 111,000 head, 0.9 per cent higher than last year. Feedlots were able to move a few more cattle this week but it came at a price as the average fed price for the week was $130.66/cwt, 2.2 per cent lower than the previous week and 17.5 per cent lower than a year ago.
Feedlots are slowly starting to become more current in their marketings, which should help once spring beef demand starts to kick in. That is the key wild card for the cattle market in April and May.
Futures have been trading higher in the last few days in a nod to that expected seasonal improvement. However, there is not a lot of conviction past the normal seasonal improvement for Memorial Day, evidenced in the huge spread between June and August cattle.
USDA presented in its annual Agricultural Outlook conference its first estimates of grain supplies and demand during the 2016-17 marketing year. The official USDA estimates will be published in the May WASDE report but the outlook presentation last week offers a glimpse as to what USDA analysts are thinking as farmers start preparing for the new season.
There appears to be broad consensus among industry analysts that corn farmers will plant more corn this year than a year ago. Given weak corn prices this may appear as counter intuitive but USDA believes that corn prices relative to other alternatives and lower prices for fertilizer and fuel will induce farmers to continue to plant corn.
In all, corn plantings are expected to be 90 million acres compared to 88 million last year. USDA used a yield similar to last year in its balance sheet.
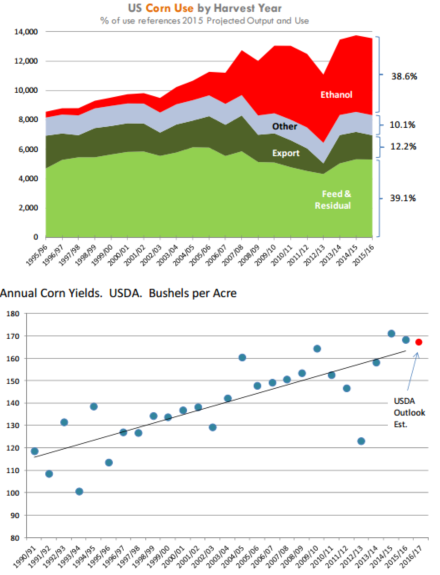
The chart below shows yields since 1990 and linear trend would imply yields around 164 bushels. You get closer to the USDA estimate if you only use the trend for the last 20 years and remove the 2012 yield (outliner) from the calculation. As always weather is a key wild card going forward.
Weather impacts not just overall yield but also prevent plantings. Total available corn supply (starting inventories + production + imports) is estimated at 15.7 billion bushels, about 2 per cent larger than last year. Feed demand is seen increasing but given the large supply of DDGs and higher pasture feeding it should not be a surprise why corn per animal unit has not exploded.
Also important to consider in terms of feed demand is that livestock and poultry producers are slowing things down. Export and ethanol demand is seen as flat at best, implying ample corn supplies and lower prices than in 2015-16.


