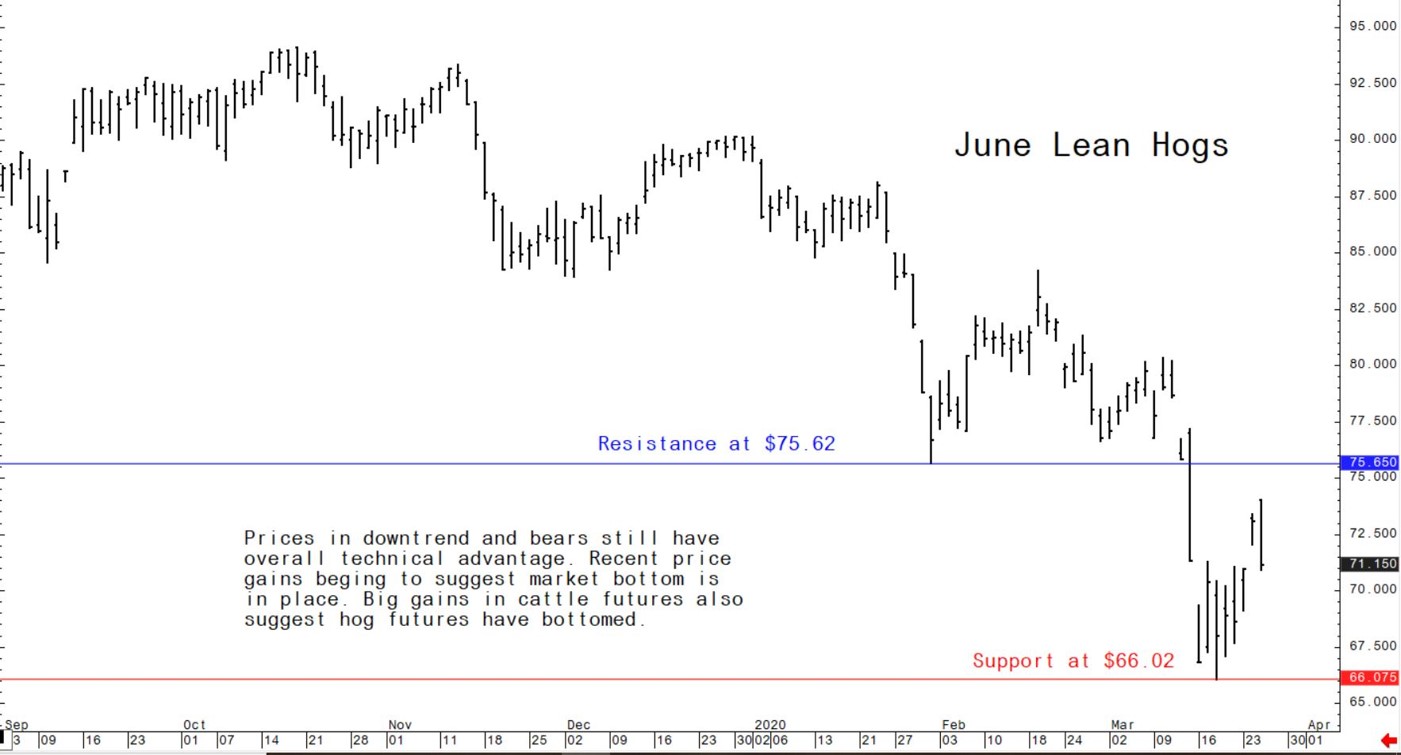
Chart clues suggest US pork futures have now bottomed out
This week’s price gains in lean hog futures (as of Thursday morning), combined with last week’s stabilisation in that market, do provide early technical clues that the hog market has bottomed out and that prices will now trend at least sideways, if not sideways to higher, in the near term. 27 March 2020
 2 minute read
 By:
By: US consumer demand for pork and beef remains strong, partly due to stockpiling of meat in consumers’ freezers as the US public is advised to stay home as much as possible.
Big US hog slaughter rates have limited the upside in the lean hog futures market for some time. USDA will issue its quarterly hogs and pigs report later Thursday. It is expected to report the US hog herd expanded 3.4 percent from year-ago as of 1 March, with kept-for-breeding rising 1.4 percent and kept-for-marketing climbing 3.5 percent.
The global stock and financial markets have stabilised late this week, which has helped out the global agricultural market sector. If the world financial markets continue to show stabilisation, it would then be very likely that the worst is over for the livestock sector, from a markets-price perspective.
The next week’s likely high-low price trading ranges
June lean hog futures: $66.00 to $74.00, and with a sideways.
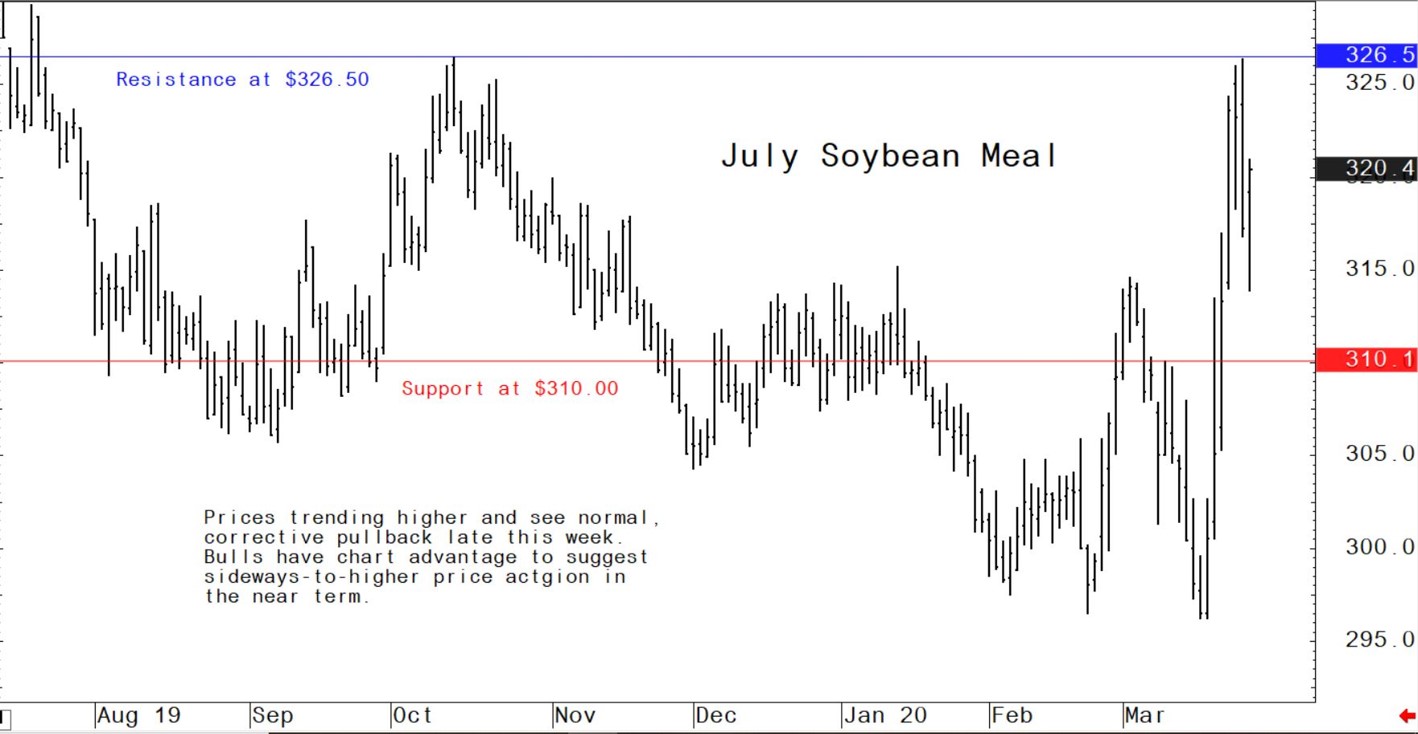
May soybean meal futures: $310.00 to $336.30, and with a sideways.
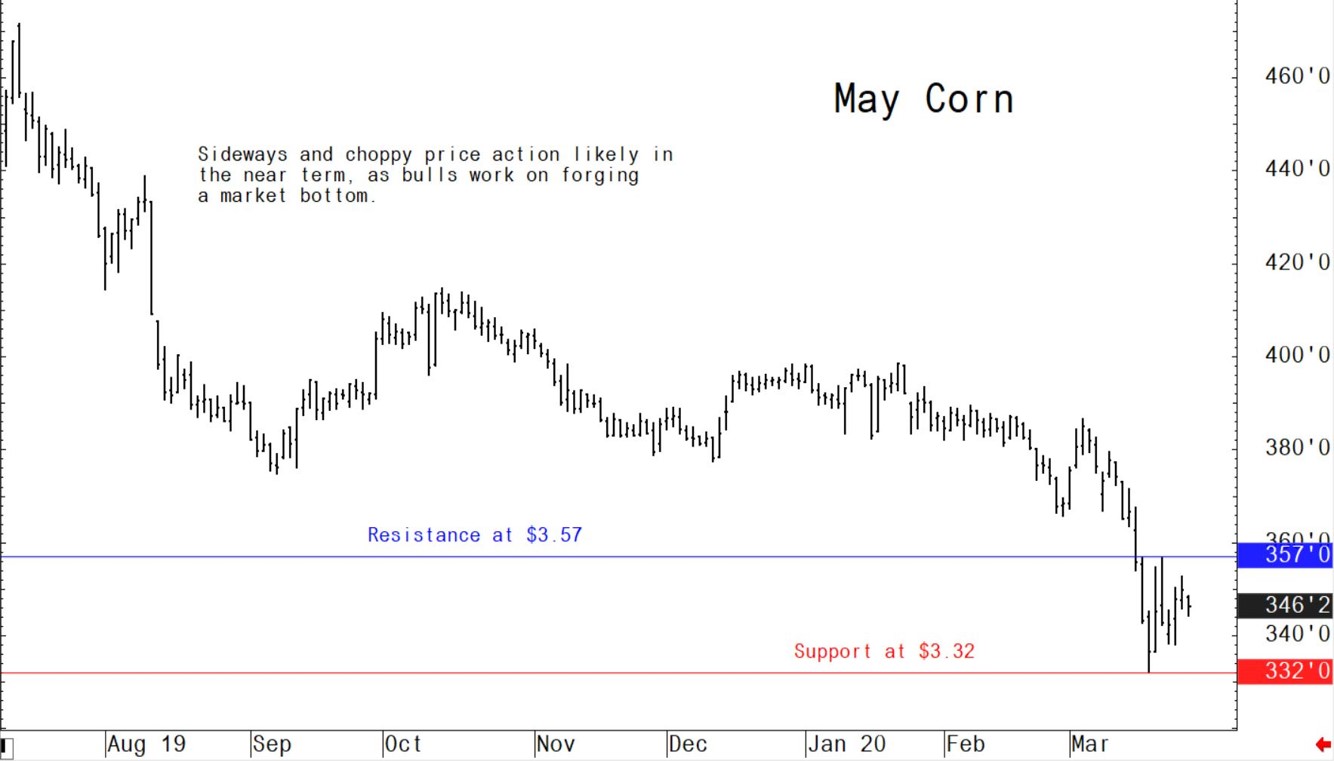
May corn futures: $3.32 to $3.57, and a sideways bias.
US pork export sales rise in latest week, but livestock feed sales see substantial gains
Pork
The latest weekly USDA exports sales report, released Thursday morning, showed US pork net sales of 38,600 metric tons (MT) reported for 2020 were up 8 percent from the previous week and 89 percent from the prior 4-week average. Increases were primarily for Mexico (11,100 MT), China (9,500 MT), Japan (9,400 MT), Canada (2,400 MT), and Chile (1,200 MT). Exports of 48,600 MT - a marketing-year high - were up 13 percent from the previous week and 12 percent from the prior 4-week average. The destinations were primarily to China (23,000 MT), Mexico (9,600 MT), Japan (5,400 MT), South Korea (3,500 MT), and Canada (2,400 MT).
Corn
US corn net sales of 1,814,300 MT for 2019/2020 - a marketing-year high - were up noticeably from the previous week and up 81 percent from the prior 4-week average. Increases primarily for China (756,000 MT), Japan (333,000 MT, including 91,200 MT switched from unknown destinations and decreases of 2,300 MT), Mexico (219,200 MT, including 24,000 MT switched from unknown destinations and decreases of 3,700 MT), Colombia (152,900 MT, including 50,000 MT switched from unknown destinations and decreases of 3,900 MT), and South Korea (132,000 MT), were offset by reductions for unknown destinations (42,000 MT) and El Salvador (23,300 MT). For 2020/2021, net sales of 82,900 MT resulting in increases for Mexico (91,400 MT), were offset by reductions for Guatemala (8,500 MT). Exports of 846,000 MT were down 13 percent from the previous week and 5 percent from the prior 4-week average. The destinations were primarily to Japan (257,500 MT), Mexico (231,500 MT), Colombia (120,700 MT), the Dominican Republic (86,700 MT), and Guatemala (65,000 MT).
Soybean
US soybean net sales of 904,300 MT for 2019/2020 were up 43 percent from the previous week and up noticeably from the prior 4-week average. Increases primarily for unknown destinations (406,100 MT), China (199,300 MT), Indonesia (69,400 MT, including 55,000 MT switched from unknown destinations and decreases of 1,000 MT), Bangladesh (55,000 MT), and Peru (37,400 MT, including 35,000 MT switched from unknown destinations), were offset by reductions for Egypt (2,200 MT). For 2020/2021, total net sales of 500 MT were for Japan. Exports of 607,100 MT were up 26 percent from the previous week and 4 percent from the prior 4-week average. The destinations were primarily to Egypt (127,800 MT), Taiwan (94,800 MT), Japan (74,700 MT), Indonesia (74,400 MT), and China (64,300 MT).
Soybean cake and meal
US soybean cake and meal net sales of 251,200 MT for 2019/2020 were up noticeably from the previous week and up 39 percent from the prior 4-week average. Increases primarily for the Philippines (50,500 MT), Indonesia (49,500 MT), Colombia (40,100 MT, including decreases of 600 MT), Israel (27,000 MT), and Canada (19,400 MT, including decreases of 1,100 MT), were offset by reductions for the Dominican Republic (1,800 MT). Net sales of 16,000 MT for 2020/2021 were primarily for Guatemala (15,600 MT). Exports of 289,700 MT were up 20 percent from the previous week, but down 3 percent from the prior 4-week average. The destinations were primarily to Spain (60,400 MT), Indonesia (50,600 MT), Mexico (34,200 MT), Colombia (31,700 MT), and Ecuador (31,600 MT).
This week’s analytical charts, to provide clues for next week’s price action
© Jim Wyckoff
© Jim Wyckoff
© Jim Wyckoff