Analyst Jim Wyckoff's Weekly Pig Outlook: Pork futures prices trend down in April and May, but light at the end of the tunnel
The months of May and June have not been good to the hog market bulls. 5 June 2020
 7 minute read
 By:
By: The pig traders’ perspective:
Lean hog futures prices started trending lower in early May and continue to do so, with July futures hitting a six-week low this week. Upcoming USDA reports will provide better insight on US hog supplies. Lean hog futures faced more downside price pressure this week as the marketplace continues to work through a backlog of market-ready animals. Slaughter rates are increasing, which is a positive sign. One element to impact hog prices will likely be the USDA Quarterly Hogs & Pigs Report due out in late June. There’s a lot of uncertainty about how much pig liquidation occurred amid processing disruptions related to Covid-19. It is the peak grilling season at present, and the drop in pork prices at the meat counter recently could help move a lot of pork products and get the supply and demand sheet back in a better balance. Also a potential bright spot, see a brief below on some early chart clues that support better times ahead for agricultural markets.
The next week’s likely high-low price trading ranges:
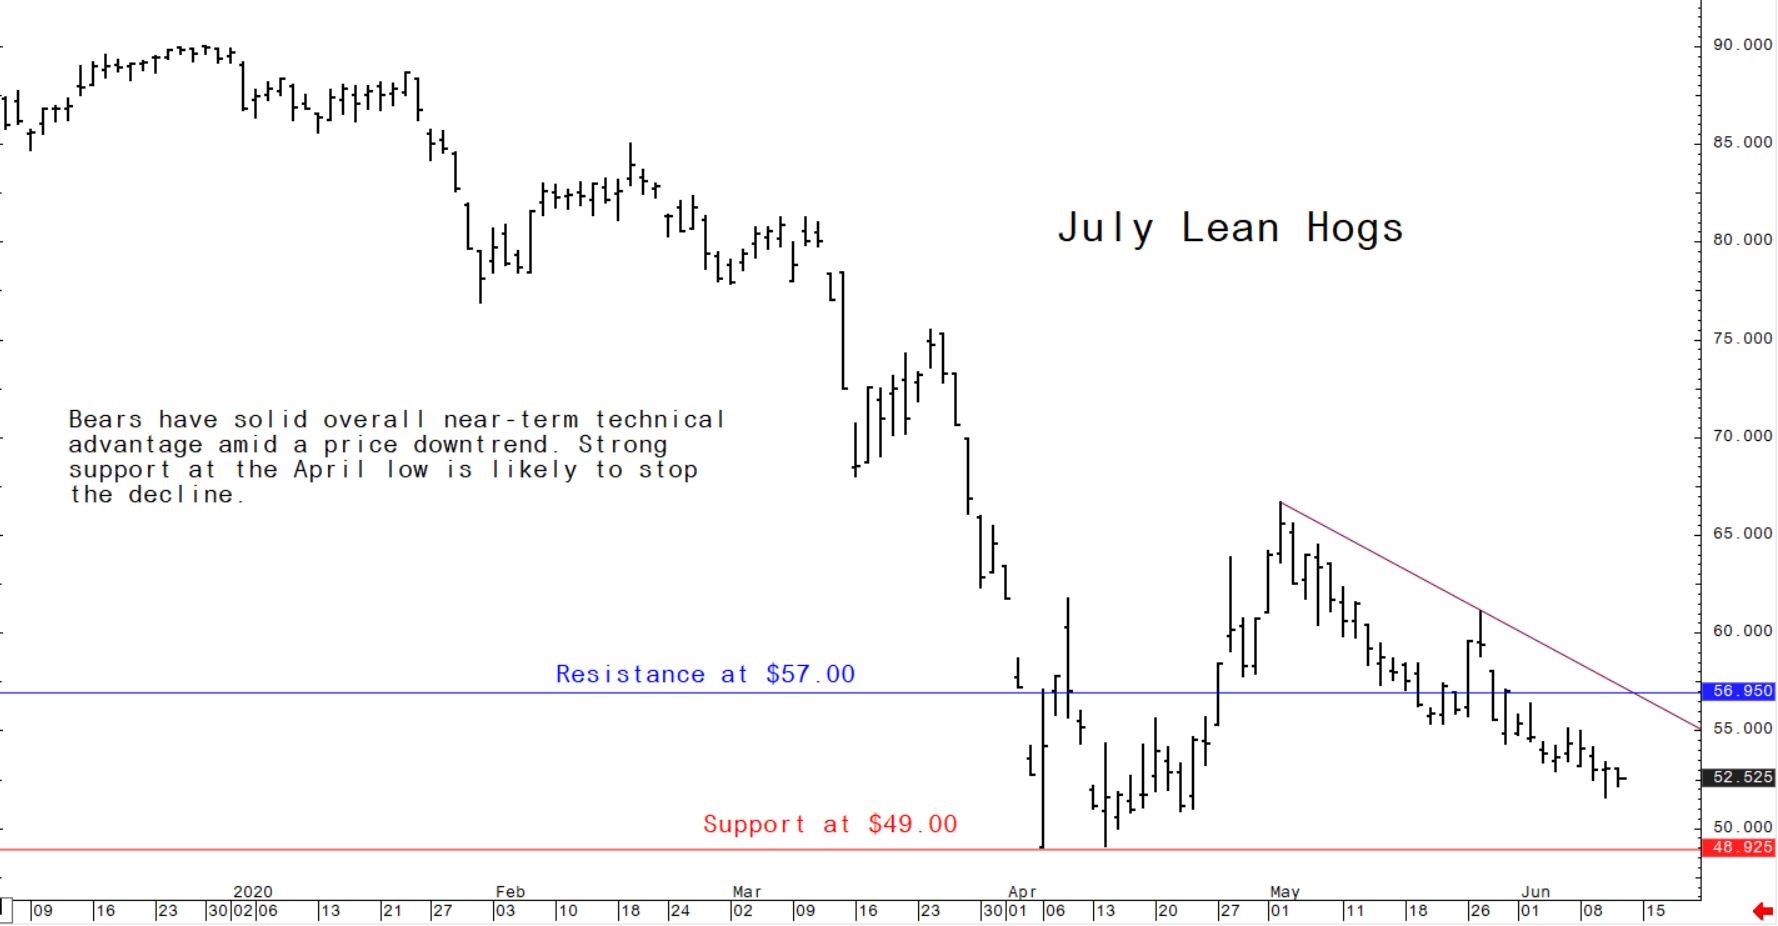
- July lean hog futures--$50.00 to $55.00, and with a downside bias
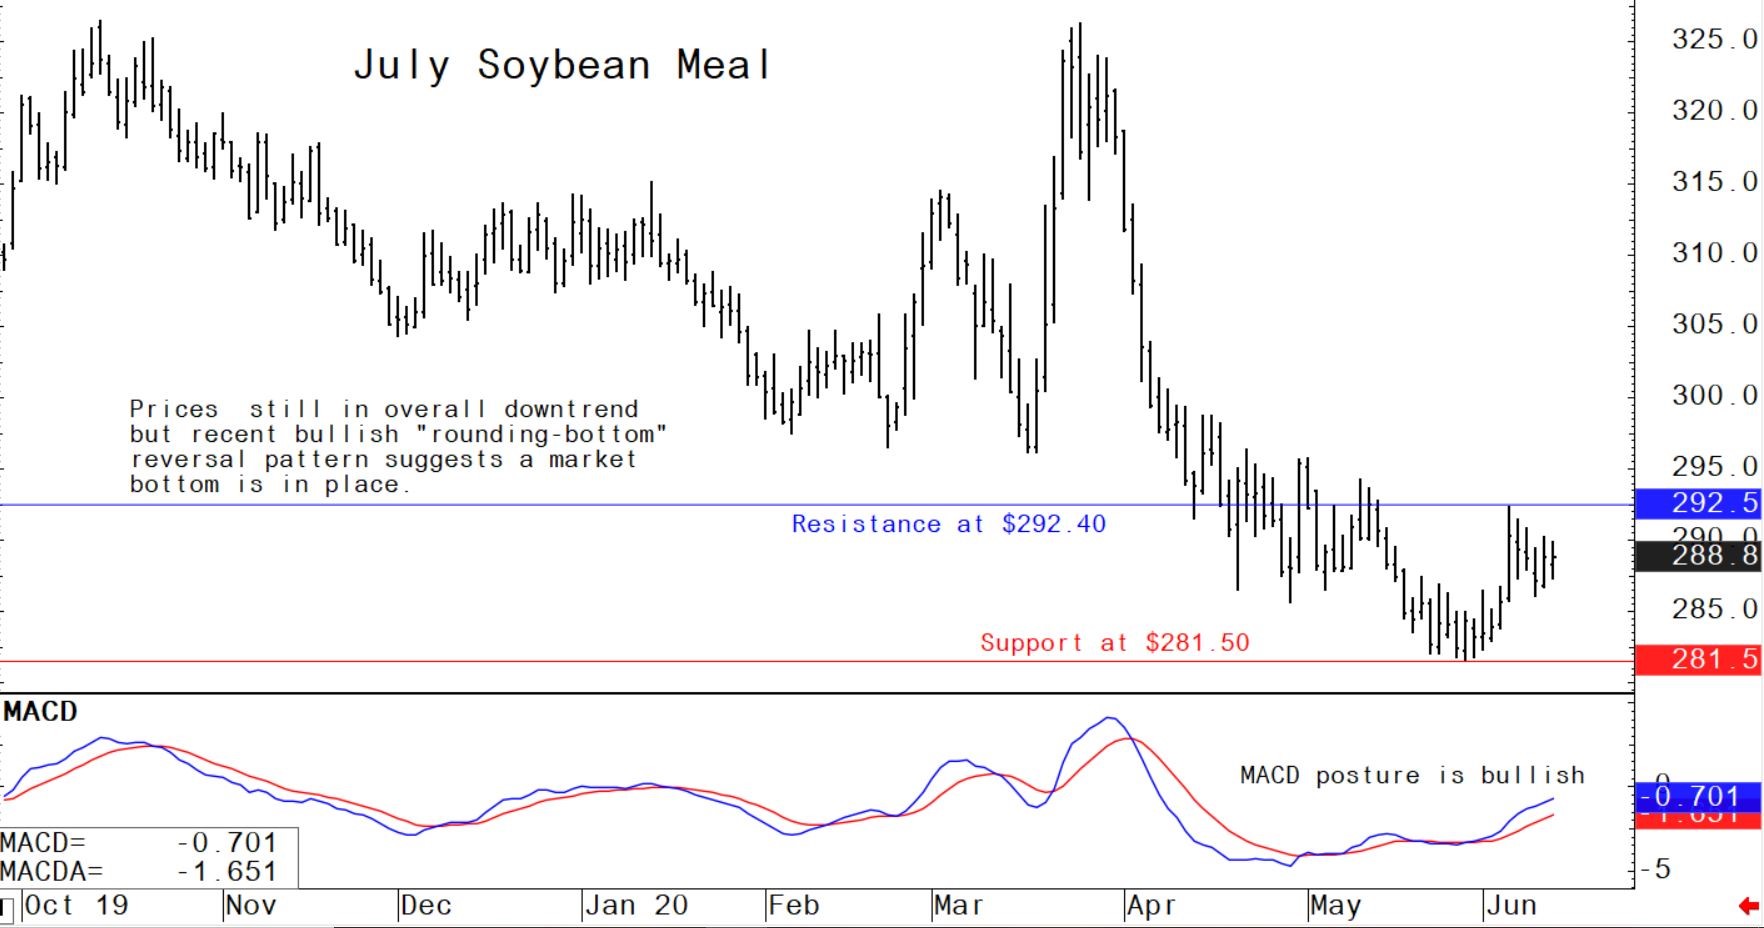
- July soybean meal futures--$285.00 to $295.00, and with a sideways bias
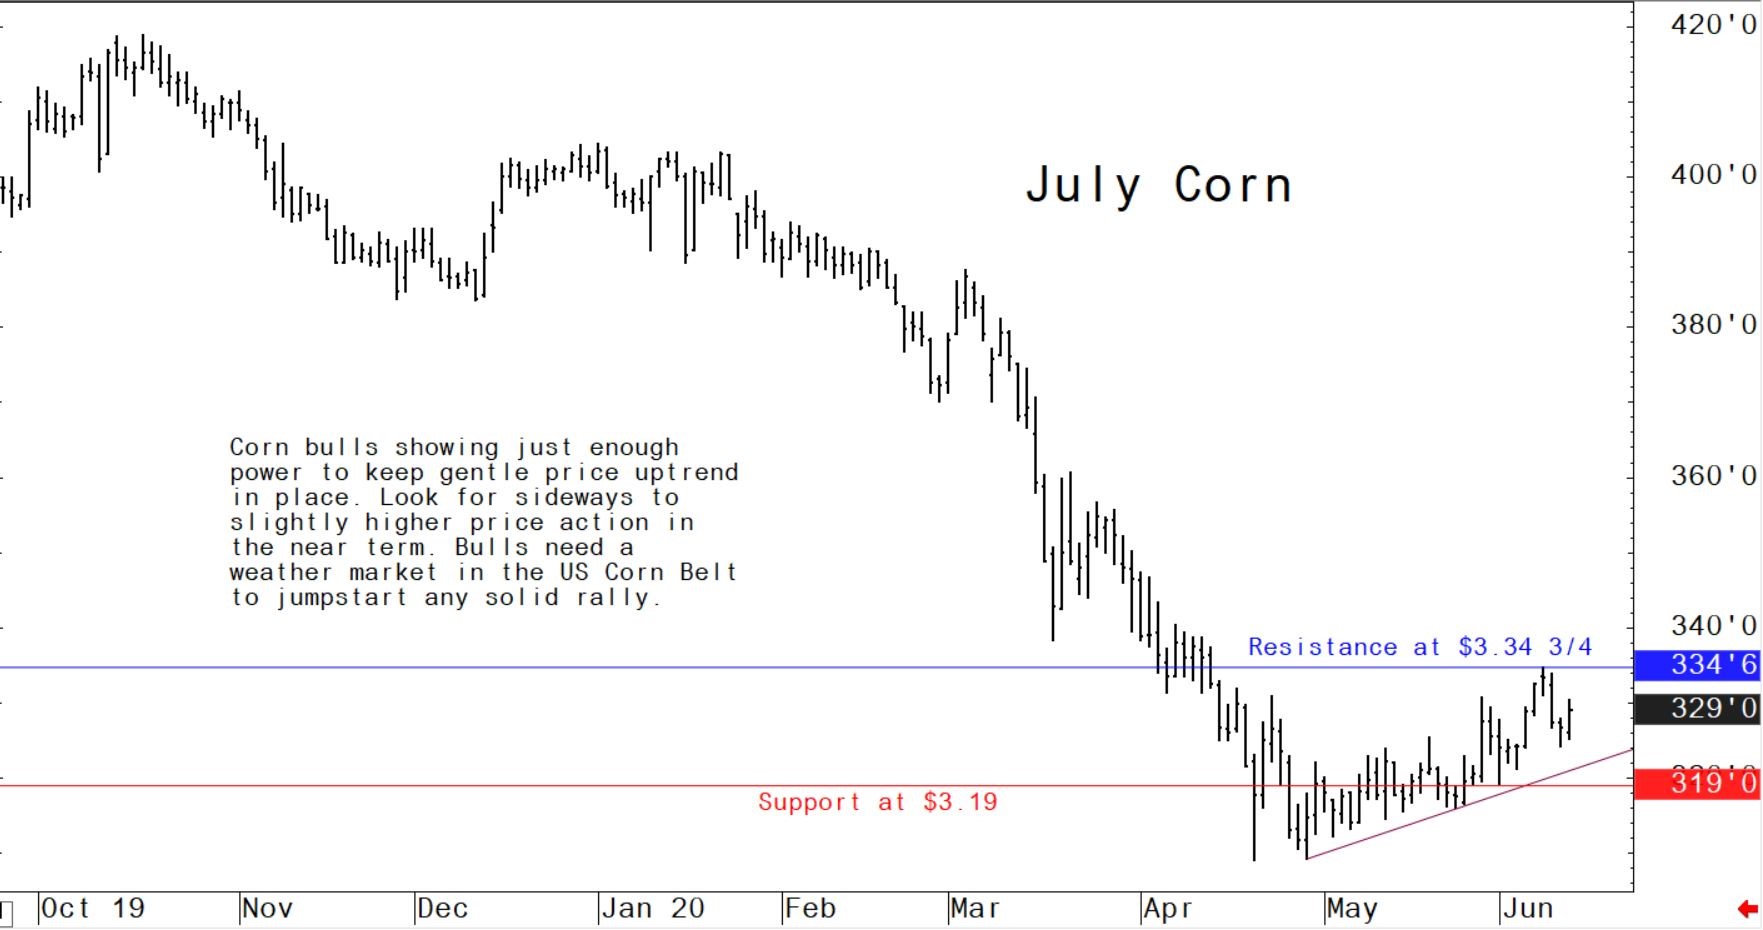
- July corn futures--$3.20 to $3.35, and a sideways-higher bias
Latest US Department of Agriculture (USDA) reports, and other news
US pork export sales remain solid
US pork net weekly export sales of 17,200 metric tons (MT) reported for 2020 were down 1 percent from the previous week, but up 60 percent from the prior 4-week average. Increases were primarily for Mexico (5,100 MT, including decreases of 100 MT), Canada (4,700 MT, including decreases of 300 MT), China (2,600 MT, including decreases of 2,600 MT), Japan (1,800 MT, including decreases of 700 MT and late 100 MT – see below), and Honduras (1,400 MT). Exports of 31,700 MT were up 1 percent from the previous week, but down 8 percent from the prior 4-week average. The destinations were primarily to China (12,700 MT), Mexico (8,200 MT), Japan (4,300 MT, late 100 MT – see below), South Korea (1,800 MT), and Canada (1,600 MT).
US beef net sales of 20,400 MT reported for 2020 were up 66 percent from the previous week and up noticeably from the prior 4-week average. Increases were primarily for South Korea (7,200 MT, including decreases of 300 MT), Japan (5,500 MT, including decreases of 600 MT), Mexico (2,300 MT), Canada (2,200 MT, including decreases of 100 MT), and Taiwan (1,900 MT, including decreases of 100 MT). Exports of 10,900 MT were up 14 percent from the previous week, but down 1 percent from the prior 4-week average. The destinations were primarily to Japan (4,000 MT), South Korea (3,200 MT), Hong Kong (1,100 MT), Taiwan (1,000 MT), and Canada (300 MT).
China decides to allow hog operations near cities; pork prices rising
Reports this week said China is working to rebuild its hog herd in the wake of a devastating African swine fever outbreak and the country has relaxed some limits on hog production to speed along that effort. One of the changes is allowing farming operations near cities. Eleven pig farms are being constructed just outside of Beijing this year. Problems with runoff leaking into water and soil of suburbs resulted in the government relocating such facilities in 2015 and 2017. Meantime, Chinese pork prices climbed 7.5% from June 1 to June 5 to 40.89 yuan ($5.79) per kilogram, according to a pork price index covering 16 provincial-level regions. Up until recent weeks, pork prices had been sliding.
“Green shoots” seen for agricultural markets, from a technical perspective
The raw commodity sector markets, including agricultural markets, took a gut punch early this spring when global economies were shocked and ground to a virtual halt amid the Covid-19 pandemic. The low point for the sector occurred in late April, when May Nymex crude oil futures expired deep in negative territory after trading at minus $40.32 at one point.
Crude oil is arguably the leader of the entire raw commodity sector and negative prices in nearby futures sent bearish shockwaves throughout many commodity markets, including grains and livestock. There were dire predictions in early May that when Nymex June futures expired in late May prices would also drop below zero. However, traders and analysts were confounded when June crude oil started to trend higher—pushing above $10, above $20, $30 and this week above $40 a barrel. Make no mistake, $40 Nymex crude is still well below the near-$60-a-barrel price levels seen in January. However, the oil market has made a strong recovery from its April train-wreck, to suggest that prices can trend at least sideways, if not sideways to higher in the coming weeks and months. If oil prices can continue to recover, it’s likely grain and livestock futures markets will do the same.
Commodity markets got an unexpected boost in early June when the U.S. employment situation report from the U.S. Labor Department showed a shocking 2.5-million gain in non-farm payrolls, when a decline of over 8 million jobs was expected. That report suggests the U.S. economy—and quite possibly the other major economies of the world—will experience the hoped-for V-shaped recoveries from their sudden plunge into recession. The jobs report also begs at least a couple important questions: Did the U.S. Federal Reserve (and other major central banks) pull out all the stops on extreme monetary stimulus too soon? If world economies do indeed recover so unexpectedly rapidly, will all that money which flooded the global financial system produce problematic price inflation? “Economics 101” classes teach such moves at least have the potential to create unwanted inflation. Historically, rising inflation in economies has worked to lift raw commodity prices, as end-users tend to want to buy more and have more on hand, reckoning higher prices are down the road.
The yield on the U.S. benchmark 10-year Treasury note remains below 1.0%, with other global bond markets also seeing yields at historically low levels. Importantly, this suggests serious price inflation is not yet close to being on the horizon. Still, the weekly continuation chart for nearby U.S. Treasury bond futures shows prices (which trade in the opposite direction of yield) have dropped well down from their spike high seen in early spring. A drop below the technical support line seen on the weekly T-Bond futures chart would produce longer-term chart damage to suggest Treasury prices trending lower for an extended period of time (rising yields).
Another potential “green shoot” for the raw commodities markets is a bullish technical signal coming from the Goldman Sachs Commodity Index (GSCI), which is a basket of several major commodity futures markets rolled into one composite price index. The weekly GCSI chart shows prices in April careened to a 17-year low, including producing big gaps down on the bar chart in March. However, in May price action on the weekly chart reversed course, including producing a big gap to the upside. The price action in April and May created a very significantly bullish “island bottom” reversal pattern, to strongly suggest a major low is in place for the GSCI, and that prices are now likely to trend higher in the coming weeks and months, or even longer.
For good measure there is one more longer-term price chart that leans bullish for the commodity markets that are priced in U.S. dollars on the global market, which is most of them. The U.S. dollar index--a basket of six major world currencies weighted against the greenback--has backed down sharply from its early-year highs. Price action has also been highly volatile, as seen on the weekly chart. This volatile price action at higher levels has produced a rare and bearish diamond pattern that suggests the USDX has put in a major top. A depreciating U.S. dollar on the foreign exchange market makes goods priced in dollars on the world market cheaper to purchase in non-U.S. currency.
A brief examination of the weekly grain futures charts reveals their longer-term technical postures, while not fully bullish, are significantly less bearish than they were just a couple months ago. Corn futures have rebounded well up from longer-term technical support levels. The weekly soybean futures chart shows recent price action has negated a downtrend line. Meantime, the weekly continuation chart for nearby soft red winter wheat futures shows a choppy price uptrend remains in place.
In the livestock sector, the weekly continuation chart for nearby live cattle futures shows a bullish V-bottom reversal pattern has likely formed, to suggest a longer-term market bottom was formed in April. The weekly lean hog futures chart also suggests that market also has put in a major low, or very close to it, although recent selling pressure in hog futures suggests the April low could be retested in the coming weeks.
This week’s analytical charts, to provide clues for next week’s price action.
© Jim Wyckoff
© Jim Wyckoff
© Jim Wyckoff