Danish Pig Research Centre Annual Report 2012: Economy
Information on production and structural development in the Danish pig industry, trends in the production, developments in productivity, competition for Danish weaners and seasonal price developments from the Danish Pig Research Centre. 12 April 2013
 10 minute read
 By:
By: 
Production & Structural Development
Structural development
In 2011, Denmark had a total of 4,500 registered pig farms. Of these, 1,800 were integrated farms with both sows and finishers. Herd size averaged 255 sows.
There were 600 specialised sow farms with an average of 950 sows, and 2,100 specialised finisher farms with an average annual production of 6,800 finishers.
Production scope
Overall production (slaughter + exports) in 2012 is expected to total 29.007 million, which is 1.6 per cent lower than 2011 when production totalled 29.465 million. In the first half of 2013, production is expected to be close the level of 2012 of 28.800 million.
This shows that the Danish pig production industry seems to be managing successfully the conversion to group-housing of gestating sows without encountering dramatic drops in production. A survey made in summer 2012 showed that 80 per cent of all gestating sows were housed in groups, and it was expected that a very large part of the farms that had yet not converted would do so before 2013.
Slaughterings in 2012 are expected to be around seven per cent below the level of 20ll, which is a reduction from 20.9 million slaughtered pigs in 2011 to 19.4 million. The first half of 2013 is currently expected to be close to the level of the first half of 2012 but the trend will depend on the development in the export of live pigs.
The export of weaners has increased over the past years. In 2012, exports increased to 9.157 million weaners, which compares with 8.039 million in 2011, representing an increase of 14 per cent.
| Table 1. Development in Danish pig production, slaughtering and export of pigs | ||||
|---|---|---|---|---|
| Year | Total slaughterings | Export pigs/sows | Export weaners | Total |
| 2006 | 21,370,409 | 789,812 | 3,578,898 | 25,739,109 |
| 2007 | 21,398,152 | 1,103,266 | 3,850,844 | 26,352,262 |
| 2008* | 21,064,216 | 1,059,997 | 5,280,258 | 27,404,471 |
| 2009 | 19,288,591 | 1,250,173 | 7,043,720 | 27,582,484 |
| 2010 | 20,243,996 | 896,191 | 7,515,047 | 28,655,234 |
| 2011 | 20,925,925 | 500,395 | 8,039,111 | 29,465,431 |
| 2012** | 19,381,365 | 468,830 | 9,157,133 | 29,007,328 |
| 2013** | ? | ? | ? | 28,800,000 |
| Based on figures reported to the Pig Levy Fund and on DAFC projections * 53 weeks ** Projections |
||||
Trends in Production Economy
Financial results
Table 2 outlines the development in production economy for full-time pig farms over the last decade.
The top part of the table shows the results of full-time pig farms and the bottom part shows financial key figures by production category.
The number of full-time pig farms has dropped by approximately 2,850 (48 per cent} in the last 10 years, while the number of sows per year per farm has increased from 193 to 273 (41 per cent}.
The number of finishers produced per pig farm has increased from 2,777 to 7,073 (155 per cent). Land has increased from 97 to 172 hectares (77 per cent}.
Gross margin including land has increased from about DKK1.5 million to around DKK3.5 million from 2002 to 2012. In 2011, gross margin per year increased to DKK3.5 million as a consequence of rising grain prices and pig prices.
| Table 2. 10-year development in Danish pig production |
||||||||||
|---|---|---|---|---|---|---|---|---|---|---|
| 2002 | 2003 | 2004 | 2005 | 2006 | 2007 | 2008 | 2009 | 2010 | 2011 | |
| No. of accounts | 2,353 | 2,053 | 1,935 | 1,852 | 1,776 | 1,694 | 1,508 | 1,660 | 1,667 | 1,611 |
| Farms | 5,926 | 5,655 | 4,870 | 4,401 | 4,176 | 4,210 | 3,447 | 3,154 | 3,529 | 3,075 |
| Sows/year | 193 | 200 | 199 | 223 | 255 | 241 | 267 | 300 | 311 | 273 |
| Finishers produced | 2,777 | 2,969 | 3,415 | 3,397 | 3,677 | 4,003 | 4,713 | 4,607 | 5,180 | 7,073 |
| Area (ha) | 97 | 104 | 112 | 115 | 125 | 136 | 148 | 148 | 150 | 172 |
| Total economy | Per farm DKK '000 | |||||||||
| Gross profit | 2,327 | 3,207 | 3,534 | 3,550 | 4,342 | 4,156 | 5,416 | 5,634 | 6,760 | 8,489 |
| Gross margin | 1,608 | 1,471 | 1,804 | 1,766 | 2,321 | 1,711 | 2,053 | 2,211 | 3,122 | 3,529 |
| Key financial figures | DKK per production unit | |||||||||
| GM/sow/yr | 3,852 | 2,853 | 3,850 | 4,033 | 4,811 | 1,893 | 2,828 | 3,398 | 4,077 | 4,153 |
| Pigs/sow/yr | 23.7 | 23.6 | 22.6 | 23.7 | 24.9 | 26.1 | 26.3 | 26.2 | 26.6 | 28.3 |
| Price/pig | 352 | 309 | 338 | 351 | 368 | 327 | 333 | 354 | 363 | 358 |
| GM/weaner | 163 | 121 | 170 | 170 | 193 | 73 | 108 | 127 | 154 | 147 |
| Price/FU (sow + weaner) | 1.40 | 1.38 | 1.38 | 1.35 | 1.31 | 1.63 | 1.95 | 1.75* | 2.04* | |
| GM/ finisher | 111 | 79 | 111 | 138 | 149 | 97 | 86 | 83 | 135 | 132 |
| FU/ kg gain | 2.95 | 2.90 | 2.91 | 2.82 | 2.96 | 2.96 | 2.88 | 2.86 | 2.87* | 2.87* |
| Price/ kg incl. bonus | 9.62 | 8.34 | 9.25 | 9.38 | 9.83 | 9.15 | 9.83 | 9.41 | 9.93 | 10.79 |
| Price per FU finisher feed | 1.15 | 1.10 | 1.13 | 1.19 | 1.08 | 1.30 | 1.67 | 1.34 | 1.36 | 1.71 |
| *Feed units (FU) 2010 and 2011 are based on production reports and account figures | ||||||||||
Economy per production unit
From 2002 to 2012, gross margin per sow and year averaged DKK3,575, while gross margin of finisher farms averaged DKK112 per finisher produced.
In 2011, gross margin on breeding farms increased to DKK4,153 per sow and year, while for finishers, it remained largely unchanged at DKK132 per finished pig produced.
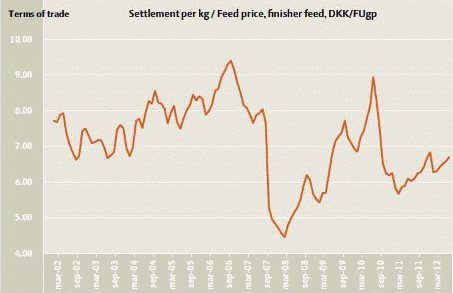
Terms of trade
Terms of trade dropped from 7.29 in 2010 to 6.16 in 2011, averaging 7.15 over the last decade.
The increases in grain and feed prices seen during harvest 2010 were reflected in 2011 when feed prices remained high all year. However, pork prices also increased. Terms of trade tended to increase in the first half of 2012 and soybean prices soared in summer 2012.
Development in Productivity
Significant progress on sow farms in 2011
Data supplied by the local pig advisory centres includes 664 sow farms with a total of 425,000 sows per year, 574 weaner farms with a total production of 9.4 million weaners; and 746 finisher farms with a total production of 4.9 million finishers.
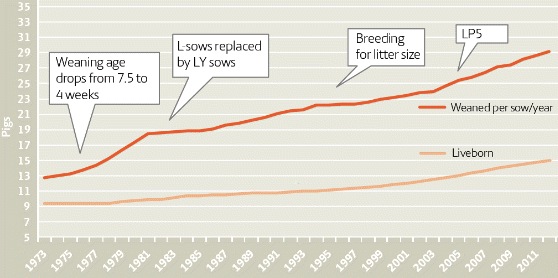
Sow farms weaned on average 28.8 pigs per sow and year, which is an increase of 0.7 pig per year compared with the previous year. Herd size averaged 640 sows.
Weaner farms produced 15,372 pigs per year on average. Data shows an FCR of 1.95 FU per kg gain, a daily gain of 443g and an average mortality of 2.9 per cent. These figures are almost identical to 2010 figures.
Finisher farms produced 6,537 pigs per year. Daily gain averaged 898g with an average FCR of 2.87 FU per kg gain. Mortality averaged 3.5 per cent and culled pigs averaged 0.2 per cent.
Top 25 per cent
The top 25 per cent of all sow farmers are four to five years ahead of the average farms. The top 25 per cent of farmers in weaner and finisher production have a performance level that is around 10 years ahead of the average farms. This demonstrates that with a dedicated effort in weaner and finisher production, it is possible to improve productivity significantly on the average farm.
Will progress continue?
Analyses of progress in annual productivity often concern mainly progress among the top 25 per cent farmers, which averaged 31.5 in 2011. This documents that many farms have an unexploited potential, which is in particular found in areas such as live-born per litter and non-productive days. Consequently, it may be possible to improve productivity levels improvements in management.
Genetic progress in LP5 (live pigs five days after farrowing) is expected to continue to improve the potential for more weaned pigs per litter partly through an increase in live-born and partly through reduced mortality. However, the economic value of a marginal pig at weaning drops if the effort of producing the pigs increases.
When litter size increases, more nursing sows are generally required, which in turn requires more work and more farrowing pens. Consequently, the value of one more live-born piglet will drop long-term.
There is no doubt that the increase in weaned pigs per sow and year will continue for years but the annual increase may slow gradually. If feed prices remain high, efficiency rather than productivity will be the central element. High feed prices will also direct attention towards feed conversion and mortality. A high feed price will result in a higher finisher price and thereby increased losses on dead pigs. Danish pig producers have at all times been highly adaptable as times have changed.
Competition for the Danish Weaner
Denmark-Germany
Weaner exports increase annually with the majority being exported to Germany. The long-term and short-term competitiveness of Danish finisher producers was compared with German finisher producers using model calculations.
Results
Danish finisher production is competitive in the long term. Short-term, however, analysis showed that German finisher producers are more competitive, particularly when the supply of weaners is low and weaner prices increase. Exports will consequently increase.
Demand for weaners
Short-term, demand depends on existing housing capacity and the expected positive contribution to earnings when weaners are moved to the house. Contribution to earnings is defined as financial result before interest and depreciation on housing facility. Once we know the pig price, feed prices and other financial costs, before interest and depreciation, related to producing a finisher, it is possible to calculate the maximum that producers are willing to pay for a weaner.
Weaner market
The pool price of a Danish weaner is also affected by German demand for Danish weaners.
When demand exceeds supply, the market value of a weaner is controlled by the accumulated maximum that all finisher producers in a given geographical area are willing to pay. This knowledge is used in the following scenarios.
Scenarios
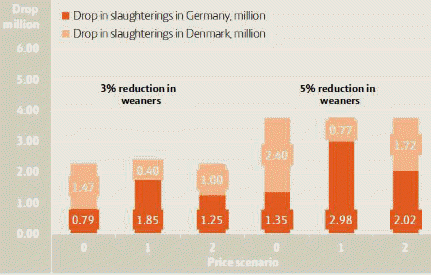
The expected 'normal' level of demand for weaners in 2013 is expected to correspond to 20 million Danish and 55 million German finishers. The implications for Danish pig producers of a three or five per cent drop in the supply of weaners in 2013 are calculated in the following price scenarios.
| Table 3. Price prerequisites | |||
|---|---|---|---|
| Price scenario | 0 | 1 | 2 |
| Feed price DKK/FUgp |
1.70 | 2.15 | 2.15 |
| Settlement DKK/kg |
11.80 | 11.80 | 13.00 |
Scenario results
Results are shown in Figure 3. Generally:
- High feed prices is an advantage for Denmark
- High settlement prices are an advantage for Germany
A five per cent drop in the supply of weaners will overall result in 3.75 million fewer slaughterings in Denmark and Germany put together. This will drop to 2.4 millions if the supply of weaners only drops by three per cent.
Despite the fact that the Danish finisher industry is smaller than that in Germany, price scenario 0 combined with a five per cent reduction in weaner production in Denmark and Germany in 2013 will result in 2.4 million fewer slaughterings in Denmark, i.e. a greater reduction in slaughterings in Denmark than in Germany. With price scenario l, the number of slaughterings drop in Denmark. while with scenario 2, export of weaners to Germany will increase. This would occur despite the fact that increases in feed prices are not quite covered by increasing settlement in scenario 2.
The overall German advantage in the short term is attributed to the German tax regulations for agriculture, 'Pauschal', which favour German finisher producers, enabling them in the short term, to pay more for a weaner than a Danish producer.
Future competitiveness
Long term, competitiveness is the ratio between production costs and settlement in a given area. Analyses show that production costs are almost identical in Danish and German finisher production. Provided settlement is identical and the supply of weaners has been brought to a 'normal' level, Danish finisher production will still be able to match the German production.
Seasonal Variations in Prices
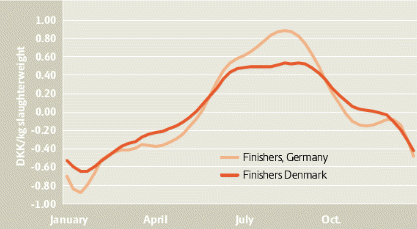
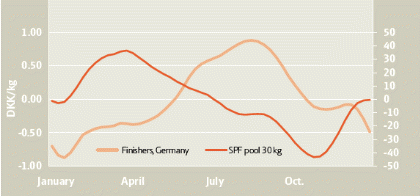
Weaner prices are peaking
German finisher producers include the normal seasonal variations in finisher prices. However, this does not allow the German finisher producers to predict the price of a finisher. Only the regular seasonal variations are included in the expected finisher price.
The development in weaner prices can thereby not be used for predicting the future price of finishers.
Seasonal variations in pig prices in Germany averaged DKK1.75 per kg from top to bottom compared with DKK1.17 per kg in Denmark. This means that prices may be slightly higher in Germany in peak season than in Denmark without the annual price necessarily being higher in Germany (Figure 4).
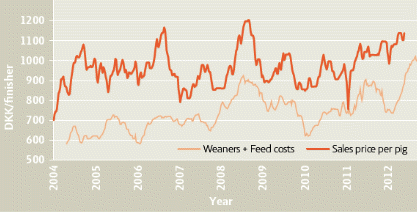
Pig prices 2004-2012
Over the past years, prices have increased from a low level of approximately DKK9 to DKK10 per kg to above DKKll per kg in 2012. Prices have fluctuated in brief cycles and each time, they peaked slightly higher (Figure 5).

Weaner market
Pool prices are higher usually higher than the calculated price in the first half of the year, while the calculated price historically is higher from the beginning of summer until the end of autumn. As an average of several years, the difference between the calculated price and the pool price is insignificant (Figure 6).
Economy in German pig production
When finisher producers buy weaners on the basis of their expectations to the pig price by the time they are going to sell the pig as a finisher, gross margin (GM) per pig becomes more stable than for finisher producers buying weaners at the calculated price. Seen over an entire year, weaner prices are fairly similar, and differences in overall GM for a year will therefore not differ significantly.
April 2013