Pork Outlook Report - March 2003
By U.S.D.A., Economic Research Service - This article is an extract from the March 2003: Livestock, Dairy and Poultry Outlook Report, highlighting Global Pork Industry data. The report indicates that in early 2003, pork production has been larger than expected. 31 March 2003
 6 minute read
| Overview |

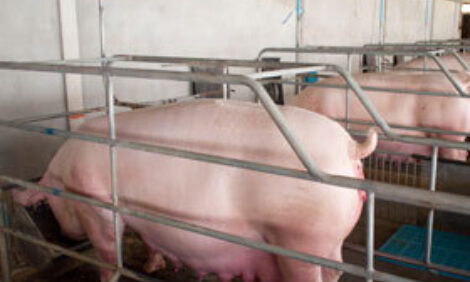
Hog producers continued to reduce their breeding herds.
In early 2003, pork production has been larger than expected. The larger than expected hog slaughter may reflect more gilts coming to slaughter as producers reduce the sow and gilt inventory.
| First-Quarter Hog Slaughter Larger Than Anticipated |

The higher slaughter is expected to push pork production almost 3 percent above first-quarter 2002 levels. First-quarter hog prices (barrow and gilt: national base live equivalent) are expected to range between $35 and $36 per cwt. USDA will release the Quarterly Hogs and Pigs report on March 28, 2003.

| Estimated Packers’ Margins Running Ahead of Last Year |
Estimated packers’ margin (equal to Estimated
Pork Carcass Cutout minus National Base Cost) for
January-February averaged 59-percent above the
same period of 2002. Despite lower pork product
prices, packer margins are higher this year, largely
because costs of major inputs-- hogs-- are lower
than in the same period last year.
The average
January-February Composite Cutout was 9-percent
lower than in the first 2 months 2002. In fact, of
the 6 primal pork cuts (loins, butts, picnics, ribs,
hams, bellies) that comprise the Composite Cutout,
only belly prices traded at prices above those of
January-February 2002. On the other hand,
packers paid almost 14-percent less for 51-52
percent lean hogs, as measured by the National
Base Lean Slaughter Cost. Thus, U.S. packers
began 2003 with higher margins largely because
they are paying lower prices for hogs.
| Exports and Imports Increase in 2002 |
The United States exported 1.6 billion pounds of
pork in 2002, an increase of 3.5 percent over the
previous year. Exports last year thus accounted for
8 percent of 2002 U.S. pork production, and
represented the 11th consecutive year-over-year
export quantity increase. The top three major
foreign markets for U.S. pork products in 2002
were Japan (48 percent), Mexico (19 percent), and
Canada (12 percent). Taken together, these three
markets comprised 79 percent of U.S. exports last
year. The United States is expected to increase
exports of pork products in 2003 by 2 percent.
Japan imported 5-percent more U.S. pork products
last year than in 2001. Japanese demand for U.S.
pork products increased despite lackluster
economic growth and higher minimum import
prices imposed by Japan’s Safeguard. Domestic
pork production was lower, however, suggesting
that imported products contributed to maintaining
established consumption levels. U.S. exports to
Japan in 2003 are expected to be slightly higher
than in 2002.
Small increases in Mexican pork production may
also explain the small decline in pork imports from
the United States, but weaker economic growth and
a weaker peso are likely factors as well. U.S.
exports to Mexico in 2003 remain uncertain with
the ongoing antidumping investigation by the
Mexican Government against imported U.S. pork
products.
The small increase in Canadian demand for U.S.
pork products last year likely reflects ongoing
integration of U.S. and Canadian pork industries.
The United States is expected to increase pork
exports to Canada in 2003, along the same order of
magnitude as last year.
Two smaller Asian markets--South Korea and
Taiwan--accounted for a larger share of U.S.
exports last year, than in 2001. The South Korean
market represented almost 5 percent of U.S.
exports last year (versus 2.5 percent in 2001). The
U.S. agricultural attaché in South Korea, attributes
increased Korean demand for imported meat
products to several factors, the most important of
which include the changing “…dietary pattern from
grain/vegetable based, to a more meat-based diet.
The appreciation of the Korean won against the
U.S. dollar is also playing a favorable role in
enhancing meat imports.”
Taiwan accounted for 3-percent of U.S. exports in
2002, as compared with 1.6 percent in 2001.
Taiwan’s imports of pork products increased as its
hog inventory continued to contract, following the
1997 FMD outbreak, and WTO accession last year.
Taiwan’s current system of TRQs for pork bellies
and variety meats will be liberalized and subject to
tariffs only, in 2005. Increases in U.S. exports to
both South Korea and Taiwan in 2003 are likely,
but are contingent on the ability of U.S. products to
compete favorably in South Korea against
Canadian and European products; in Taiwan,
imported U.S. pork products compete mainly with
those of Canadian origin. USDA will release
Livestock and Poultry: World Markets and Trade,
on March 20, 2003.
Russia’s share of total U.S. pork exports declined
to 2.6 percent in 2002, from a 5.3-percent share of
U.S. exports in 2001. The largest foreign suppliers
of pork products to Russia in 2002 were Brazil
(with a 60-percent share of total Russian pork
imports), the EU (18 percent), and China (11
percent). Canada accounted for 4 percent of
Russian pork imports last year.
It is likely that Russian demand for U.S. pork
products will continue to lag in 2003, due to a new
set of meat import policies currently being
implemented by the Russian Government. On
January 23, 2003, the Russian Commission on
Protective Measures in External Trade and
Customs and Tariff Policy published three decrees
announcing the implementation of an import quota
for poultry and TRQs for beef and pork. The
Commission introduced a 450,000 metric tons
(MT) TRQ for pork under HS 0203 (fresh and
frozen pork). The in-quota duty for pork will be 15
percent, but not less than 1.06 euros/kg. The overquota
duty for pork will rise to 80 percent. The
beef and pork TRQs will be implemented on April
1, 2003, with 90 percent of the TRQ volume
allocated on a pro-rated basis to importers based on
historical imports during the period 2000-2002.
There is no country allocation for either
commodity. The remaining 10 percent of the
quotas for beef and pork will be allocated by
auction. For pork, 33,750 tons will be divided into
33 lots of 1,000 tons and one lot of 750 tons. The
auction will be conducted in May 2003, one month
after implementation of the TRQs. For 2003, the
9-month pro-rated TRQs are 337,500 MT for pork.
Former Soviet Union countries (i.e. Ukraine) are
exempted from the TRQ. Officially, the TRQ
system could remain in place until 2010.
In 2002, the United States imported 1.1 billion
pounds of pork products, an increase of almost 13
percent over 2001. Most of the increase came from
Canada, whose exports to the United States
increased 15 percent. Denmark’s exports to the
United States in 2002 increased 2 percent over
2001. U.S. pork imports in 2003 are expected to
increase, but at a slower rate than in 2002 given
expectations for a lower exchange rate for the U.S.
dollar. Increased U.S. imports from Canada
represent the growing irrelevance of the U.S.-
Canada (geographic) border, with respect to pork
trade. Large U.S. imports are an ongoing
indication that purchasing agents in the United
States, whose objective is to secure pork products
for sale and distribution in North American retail
and foodservice outlets, are willing to source
products wherever in North America pork product
costs are minimized.
The United States imported 5.7 million hogs last
year, most of which were of Canadian origin, and
65 percent of which were feeder pigs. Live hog
imports in 2003 are expected to be about the same
as last year, given slower hog sector expansion in
Canada (i.e., Canadian hog producers reported 14.7
million head on farms, as of January 1, 2003, 2.5
percent higher than last year, but hog inventory
growth has averaged 5 percent over the past 5
years). Also, Canadian producers have concerns
about the implementation of the U.S. Country of
Origin Labeling law in 2004.
| Further information |
Links
For more information view the full Livestock, Dairy and Poultry Outlook - March 2003 (pdf)Source: Livestock, Dairy and Poultry Outlook - U.S. Department of Agriculture, Economic Research Service - March, 2003