

CME: Four-year Hog Production Not Evident in Hog Production
US - In the June 2012 edition of "PorkNetwork" (formerly "PORK") magazine, Dr Ron Plain of the University of Missouri makes a very interesting observation that piqued our interest, write Steve Meyer and Len Steiner.He wrote:
"The traditional four-year hog cycle is not much evident in hog production, but it still show up in hog profits."
As usual, Dr. Plain’s observation is spot on. One of the most predictable — and thus useful — output cycles in all of agriculture and business and statistics in general has fallen on hard times in recent years. But the profits generated by that output appear to be just as cyclical as ever. We thought those two related but different outcomes deserved a bit of investigation.
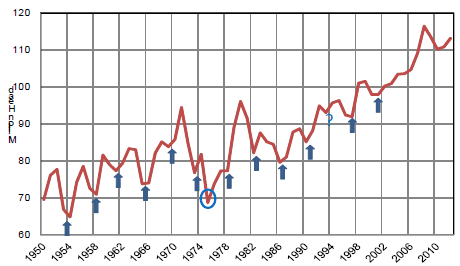
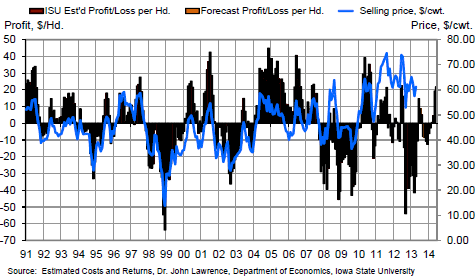
The historical hog production cycle can be clearly seen in the top chart below. Commercial hog slaughter has generally trended higher since 1950 with the most severe interruption occurring in the early 1970s when inflation began to take hold in the US and hog production costs were exacerbated by the grain price spike in the wake of the 1972 Russian grain purchase. The output reduction in response to that cost shock is noted by the circle in the chart. The only other exception to the four-year cycle through 2002 was in 1994 when producers grew right through a price cycle low (see the bottom chart) as the great structural shift to larger, more technically advanced enterprises got underway in earnest.
US Commercial Hog Slaughter, Annual

Profit Per Head
Iowa Farrow-to-Finish Operations

But since 2002,the only deviations of hog slaughter from a steady upward trend line have been driven by technology and a major increase in costs. The upward spike in 2008 was the result of effective circorvirus vaccines’ enabling more pigs to reach market weight. The drop in 2009 and 2010 was a response to HUGE losses in 2008 and 2009 caused by the quantum increase in feed costs associated with the emergence of fuel ethanol as a major user of corn.
But, as Dr. Plain points out, the profit cycle continues. The bottom chart presents the familiar monthly profit data from Iowa State University’s Estimated Costs and Returns series as well as the hog price in dollars per hundred pounds, live weight. It is clear that a profit cycle is indeed still alive but that it is arguably longer than the four-year output cycle highlighted in the top chart. It is also clear that the four-year price cycle has fallen apart in much the same way of the four-year production cycle. Why the difference?
First, the cycle is longer simply because it takes longer to react given today’s production technology. Growth involves large capital investments that will be well thought out and take time to execute. Reductions involve idling some of these highinvestment facilities, a decision that will be made only if necessary. When hog sector expansion was executed by breeding some gilts from the finishing pen and putting a few huts into a pasture, things could happen quickly. Not any more.
Second, the driver of the profit cycle is no longer simply the price of hogs. Costs were quite steady prior to 2007 so the four-year production cycle drove a four-year price cycle that drove a four-year profit cycle that drove the four-year production cycle. Producers appeared to react to prices because prices and profits were highly correlated due to relatively stable costs. More volatile costs now work with less cyclical prices to still drive a somewhat cyclical profit picture. Will that profit cycle again drive a hog production cycle? We’ll see.


