Number of Economic Factors Play into 2015 Hog Markets
US - US pork exports in October were nothing to write home about, but they were substantially improved from August and September levels, writes Steve Meyer for the National Hog Farmer. 9 December 2014
 3 minute read
 By:
By: That’s our take on the product weight export data released on December 5 by the US Department of Agriculture’s (USDA) Foreign Agricultural Service (FAS) and, in carcass equivalent terms, this morning by the Economic Research Service.
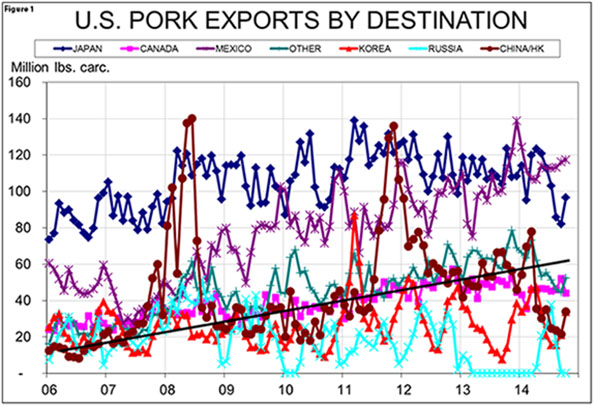
A chart of monthly exports to key US markets appears in Figure 1.
Some highlights of October’s export data include:
- Total exports amounted to 383.5 million pounds, carcass weight equivalent. That figure is the largest since July but was 11.9 per cent smaller than one year ago. It brought the year-to-date total to 4.1 billion pounds, carcass weight equivalent. That figure is still barely – by 0.4 per cent – larger than one year ago.
- October pork cut exports were valued at $465.3 million, 1.6 per cent higher than last year. Year-to-date pork export value stands at $5.136 billion, 8 per cent more than last year. Clearly, this year’s higher prices have more than made up for flat export volume, suggesting the export demand remains strong. This conclusion is even stronger if one considers the fact that the currencies of Brazil and Canada have weakened thus making their product more competitive and that the Japanese yen is 13 per cent less valuable relative to the U.S. dollar versus Dec. 1, 2013.
- Mexico was, for the seventh month this year, our largest single destination for muscle cuts. The 117.4 million pound of carcass weight pork shipped south in October was 4.6 per cent more than one year ago and brings the annual total to 1.135 billion pounds, 15.7 per cent more than for the same period in 2013.
- Exports to Japan rebounded nicely from their lowest months since 2007 in August and September. The 96.7 million pounds sent to Japan in October were still 22 per cent lower than last year. Year-to-date shipments to Japan are, at 1.053 billion pounds, down 6.2 per cent from one year ago.
- Shipments to China-Hong Kong continue to struggle, trailing year-ago levels by 43 per cent in October. These markets took 406.5 million pounds through October, 26 per cent less than last year. High hog numbers and low domestic pork prices are the primary reasons for low sales this year. Anecdotal reports indicate that liquidation is happening and that Chinese output will be lower in 2015, though the USDA’s FAS is currently forecasting Chinese production to increase by 1.5 per cent .
- The only other market showing growth in October and for the year so far is South Korea which took 137 per cent more pork than one year earlier in the month. Those purchases brought the YTD total to 306 million pounds, up 43 per cent from last year. That total is still lower than the January-to-October shipments to South Korea in 2011 and 2012 but those levels were reached following the country’s bout with hoof-and-mouth disease. We still believe South Korea is a tremendous growth opportunity as the free trade agreement gets fully implemented.
- Mexico remains the No. 1 variety meat market in terms of value while China and Hong Kong took just barely more variety meats last month. Total pork variety meat exports are down 5.3 per cent in volume and 7.8 per cent in value this year. It makes sense that higher prices will have a bigger impact on the sales of these products that normally go to price-sensitive market segments.
October’s year-on-year decline in exports and a drawdown of freezer stocks more than offset lower production to put pork disappearance 3.2 per cent higher than one year ago. Per capita disappearance was 2.6 per cent higher. In spite of more pork available to U.S. consumers, the deflated price of pork grew by 6.9 per cent versus one year earlier. Higher usage and a higher price can only mean that pork demand was once again up versus one year ago. In fact, real per capita expenditures (RPCE) for pork grew by 9.6 per cent , year-on-year, in October. That gain pushed the year-to-date RPCE gain to 7.4 per cent . See Figure 2.
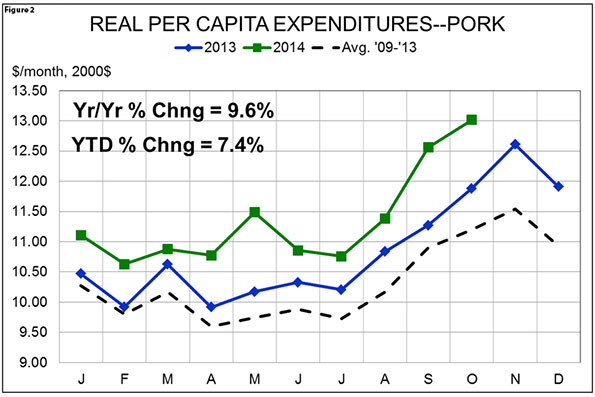
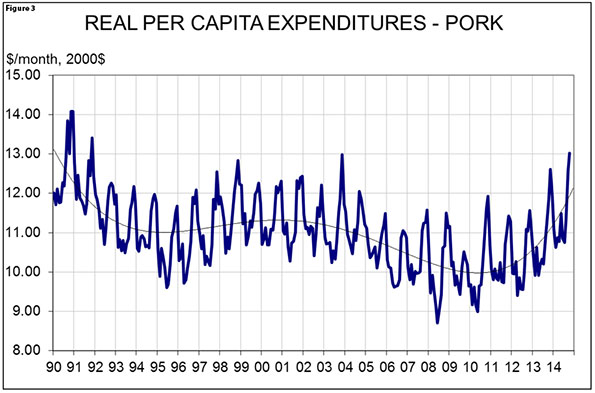
October’s RPCE of $13.02 in year-2000 dollars marked the first time since November of 1991 in which pork’s RPCE has exceeded $13. The long-term chart for RPCE appears in Figure 3. The seasonal high for RPCE usually occurs in November so this measure of pork demand may get even stronger.
Whether the demand strength of 2013 and 2014 can be extended through next year is a major question regarding the outlook for pork markets. Improving macro-economic conditions, lower gasoline prices and extremely high beef prices all support continued strong demand. Lower chicken prices and a stronger U.S. dollar will be negative for demand. The balance of those issues will be critical to hog and pork market performance.