

December Hogs & Pigs Report: Friendly, but Ominous
US - The USDA’s quarterly Hogs and Pigs Report released Dec. 23 was friendly for Lean Hogs futures next spring and summer, but included productivity figures that confirm my concerns about supplies and high slaughter capacity utilization next fall.Some highlights of the report are:
Key report data figures that were reasonably close to averages of analysts’ pre-report estimates. The right-most column in Table 1 indicates few differences of more than 1% implying that the report will not drive large changes in futures markets. The lower-than-expected numbers of pigs weighing less than 120 pounds were the most bullish numbers, and spring and summer futures were indeed higher in late-day trading on Dec. 23 and Dec. 24. That support will hold, we think, and keep summer hog prices in the mid- to upper-$70s (per hundred pounds carcass weight). We may still see a few $80-plus hogs next summer.
.jpg)
Record-large inventories for all hogs and pigs (68.299 million) and market hogs and pigs (62.297 million). The former breaks a record set on Sept. 1, 2008. The latter breaks a record set just last quarter.
Modest breeding herd growth of only 1.1%. The Dec. 1 inventory of 6.002 million head marks the first six-million plus figure since December 2008. While closely watched, this figure is a very poor indicator of subsequent hog supplies – but we watch it closely anyway, I suppose.
Downtrend mystery
A continuing decline of farrowing intentions relative to the size of the breeding herd. See Figure 1. Last year’s year-on-year reductions were due in large part to unusually high farrowing rates in 2014 when producers overbred in response to porcine epidemic diarrhea virus challenges the prior year.
The rate implied by the December-to-February intentions in this report (47.3%) is the lowest since early 2006. The flattening of farrowing rates in 2007 and 2008 was caused by a shift to higher weaning ages but the reason for the downtrend of recent years is still somewhat of a mystery. This trend, though, is both persistent and consistent so we are accepting it in our forecasts.
.jpg)
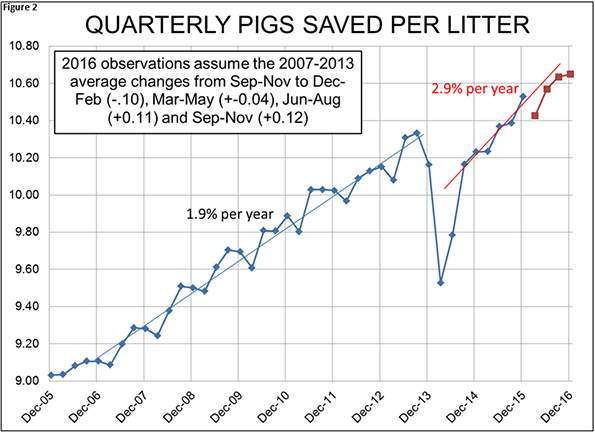
A new record of 10.53 pigs saved per litter for the September-to-November quarter. As can be seen in Figure 2, this key productivity factor has now recovered from the PEDV hit it took in 2013 and 2014. That decline came after growth of 1.9% per year from 2007 through 2012. Since recovering from the large PEDV losses, litter size has grown at a 2.9% annual clip over the last five quarters with three straight record quarterly figures. History tells us that litter size normally declines from September-to-November to December-to-February before growing once again the next three quarters. The forecasts shown in Figure 2 represent average year-on-year litter growth of 1.9% for the first half of 2016, the period during which second half 2016 slaughter hog supplies will be born. Our forecasts assume 2% year-on-year growth for first half 2016 litters.

Record hog slaughter in 2016 and a capacity squeeze next fall are very likely. A growing breeding herd and surging litter sizes will offset the slow decline in farrowing rate to produce record numbers of market hogs in 2016. That’s not a foregone conclusion as it will be nip and tuck whether 2016 sees more hogs than were slaughtered in 2008. But the capacity situation in fourth quarter 2016 may be dire. As can be seen in Figure 3, the record kill of 2.493 million head the week ending Dec. 19 exceeded total slaughter capacity as was determined by our survey last June. Weekly “capacity” though can be altered by adding a few hours or some Saturday shifts.
This USDA report, though, implies that several weeks will be at capacity next fall. The new plants in Michigan and Iowa will not be running until 2017, so fourth quarter 2016 will be the critical period. We are assuming for now that large supplies will have the expected negative effect on prices but that capacity restrictions will not exacerbate those pressures. That assumption will be under constant scrutiny from here forward. We believe the risk of prices lower than our forecasts in the fall of 2016 is very, very real.
.jpg)
Similar slaughter weights
We expect average slaughter weights to be very similar to this year with some slight variations across the quarters. Our forecast is for weights to be 1% lower in the first quarter, fractionally lower in the second quarter, fractionally higher in the third quarter and then 1% larger next fall. The net impact is to leave production changed by the same amount as slaughter for the year.
Our price forecasts appear in Table 2. At this time, we would expect cut prices to change in the same manner with cut-by-cut seasonal variation being more or less normal.
.jpg)
Bottom line: Pretty much an “expected” report that leaves 2016 hog numbers and prices pretty much the same as this year. The threat of capacity challenges in the fourth quarter of 2016 is more real than ever.
.jpg)


