Data can help improve PRRS control
Implementing metrics and utilising predictive analytics can help pork producers improve their management of porcine reproductive and respiratory syndrome say experts from Zoetis 11 May 2018
 3 minute read
 By:
By: KEY POINTS
♦ Decisions based on data from a production system affected by PRRS will be better than reactive decisions made when PRRS strikes.
♦ Implementing metrics, using predictive analytics and applying a proactive decision-making process can help pork producers improve management of PRRS.
♦ The value of applying data with a systematic approach has been demonstrated in the field.

Jose Angulo, DVM, a PRRS specialist for Zoetis.
Implementing metrics and utilising predictive analytics can help pork producers improve their management of porcine reproductive and respiratory syndrome (PRRS), said Jose Angulo, DVM, a PRRS specialist for Zoetis.
“There are many lessons learned and fewer wasted efforts when decisions are made based on data generated from an affected production system,” he said. “Producers can apply a systematic approach and make better decisions, in contrast to making reactive decisions when PRRS strikes.”
Angulo defined a metric as a mathematical function that identifies a gap between the current state and a goal.
To apply metrics, he advised using statistical process control (SPC) charts – graphs used to study how process variation changes over time – to track performance data. SPC charts come in a variety of forms and are already used in the pork industry. They’re a good way to plot and compare past and current pig performance and monitor the progress of PRRS-control programs. The charts can be especially helpful for identifying variation, which he called the enemy of swine production.
SELECT KEY PERFORMANCE INDICATORS
To start the process, a few important key performance indicators should be identified. These might include weekly data on abortion rates, live-borns or piglet mortality rates as well as total pigs weaned. Historical information for each indicator is charted and provides baseline data to compare with new information that’s collected after PRRS-control plans are initiated, Angulo said, noting that the charts can also be used to generate metrics, such as the average time between PRRS outbreaks or time to baseline production, among others.
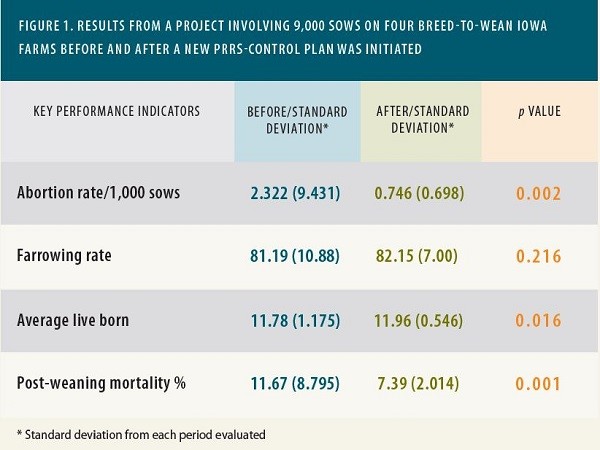
Zoetis has tested the value of this process in the field, he continued. One of the projects involved 9,000 sows on four breed-to-wean Iowa farms1 where different strategies for PRRS control, including a killed PRRS vaccine, had been unsuccessfully used in the past.
The primary immunological tool of the new plan was use of a modified-live PRRS vaccine administered quarterly to the entire breeding herd and administration of two doses to replacement gilts, Angulo said. The goals were to develop a PRRS virus-control strategy to maintain breeding-herd stability, mitigate any potential wild-type PRRS virus (WT-PRRSv) re-circulation and/or new WT-PRRSv introduction and to establish standardised processes for measuring success in applied PRRS-control interventions.
Several key performance indicators were used to measure success and were compared to the previous 18 months of production data using SPC charts. Capability analysis – a set of calculations for statistical analysis – was also used.
The results demonstrated performance problems before the new PRRS-control plan was initiated and an improvement in performance and a reduction in variability after the plan was implemented (Figure 1). Breeding-herd stability was achieved on all four sow farms, evidenced by negative PRRS virus results on polymerase chain reaction testing of suckling pigs, he said.
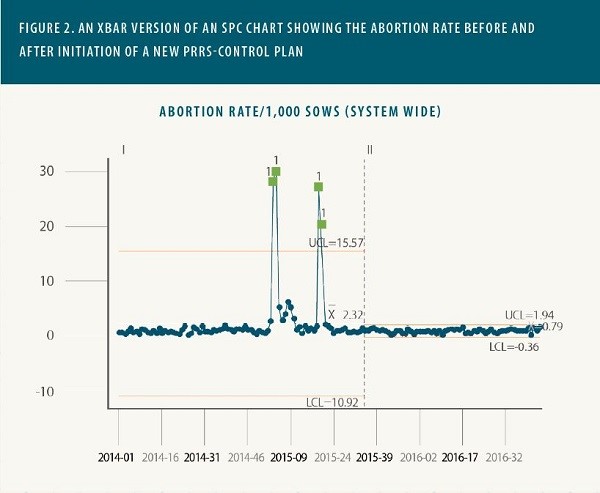
Angulo showed SPC charts from the project (Figure 2), which he said demonstrated the value of applying a systematic approach to PRRS control in breeding herds.
Using a systematic approach to monitor and evaluate decisions also provides a building block for predictive analytics, Angulo said.
Predictive analytics is defined as a technology that learns from experience (data) to predict the future behaviour of individuals in order to drive better decisions. The power of predictive analytics is already evident in other industries. In fact, most major retailers have a predictive-analytics department enabling them to improve their marketing.
In swine production systems, predictive analytics can be used to drive decisions about implementation of interventions that may minimise or even prevent disease outbreaks, he said.
As reported by Pig Health Today
1 Holtkamp DJ, et al. Terminology for classifying swine herds by PRRS virus status. J Swine Health Prod. 2011;19(1):44-56.


Emily Houghton
Emily Houghton is a Zoology graduate from Cardiff University and was the editor of The Pig Site from October 2017 to May 2020. Emily has worked in livestock husbandry, and has written, conducted and assisted with research projects regarding the synthesis of welfare and productivity of free-range food species.