Dietary energy considerations for Genesus full program pigs part 2: Setting dietary energy level
 By:
By: In part 1 of this topic, the levels of daily feed intakes typically achieved by Genesus nursery and finishing animals were covered along with a comparison to feed intake figures expected from other genotypes. Total daily energy consumption was also discussed.
Click to read Dietary Energy Considerations For Genesus Full Program Pigs Part 1 - Daily Feed Intake Potential
This article will cover how daily energy consumption can be influenced through dietary manipulation to optimize income over feed costs.
Choosing the appropriate energy level is particularly critical for diets fed to pigs from 30 kg to market weight. Feed usage during this phase represents 75 % of the total operational feed budget, and energy contributes at least 50% to the final diet costs. A key component of setting optimum energy specifications is an understanding of how various levels of daily energy intake affect pig performance and carcass characteristics.
Table 1 below provides the performance response of Genesus full program pigs to a range of dietary energy levels. The diets in this trial were based on using a combination of corn, soybean meal, corn DDGS, wheat midds, and added fat.
Five different average energy levels were tested and the table summarizes the response to the lowest energy level (base), the highest energy level (high), and those in between (intermediate). As expected, pigs decreased their daily feed intakes as the dietary energy level increased. However, total daily energy intake for pigs fed the higher energy diets increased even though their daily consumption levels of these diets decreased.
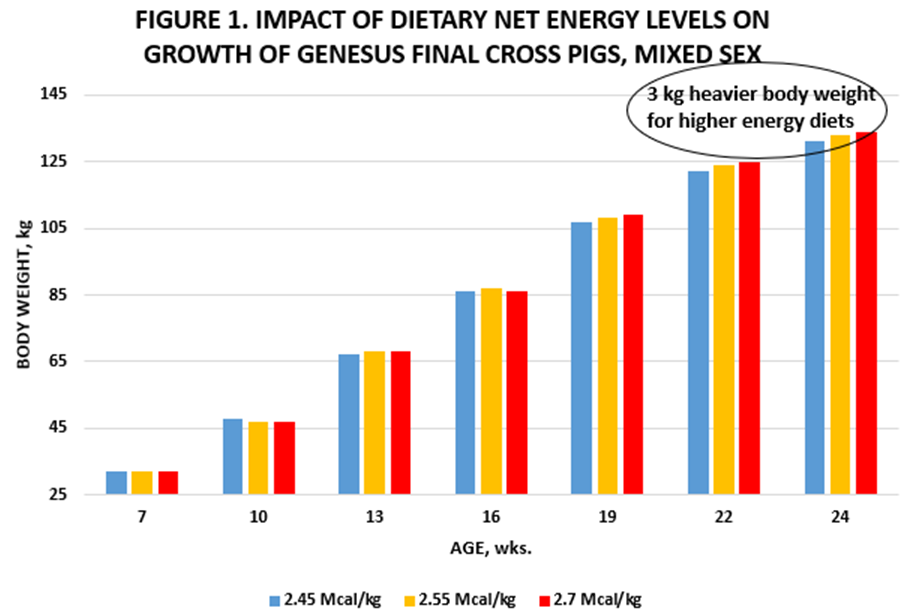
The extra energy consumed resulted in extra weight gain in late finishing, as illustrated in Figure 1. The feed-gain ratio decreased linearly as the energy density of the diets increased since pigs ate less feed but gained more weight on the higher energy diets. Caloric efficiency did not differ among treatments, indicating that the diet energy level had no effect on the way pigs used the energy consumed.
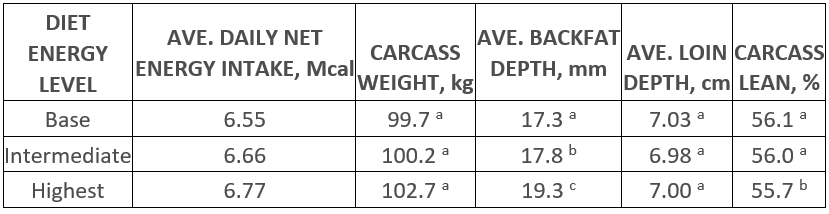
Table 2 lists the response of some carcass characteristics to the different dietary energy levels. The pigs fed the high energy diets tended to produce heavier carcasses with more backfat. The higher backfat resulted in a lower calculated carcass lean percentage.
Quantifying the responses to energy intake provides valuable information to nutritionists in determining the appropriate dietary energy level to use for different scenarios and feeding program goals. For example, a feeding program goal focused on maximum barn throughput and weight sold per year is likely to optimize results with diets set at higher energy levels. Conversely, a program which places a very high premium on lack of backfat will result in nutritionists choosing a lower energy level diet.
Spreadsheets for determining optimum dietary energy values for various production and market conditions are available to nutritionists. However, all rely on appropriate input data including growth curves, and resort to using default values if specific data are unavailable. Understanding how the Genesus pig responds to dietary energy levels allows better use of such tools and aids nutritionists in developing a specific feeding program that optimizes income over feed cost for Genesus pigs.
For more information on specifications for feeding the Genesus pig, please contact your nutritionist or consult the Genesus website at www.genesus.com for a complete copy of the Genesus Feeding Guidelines.
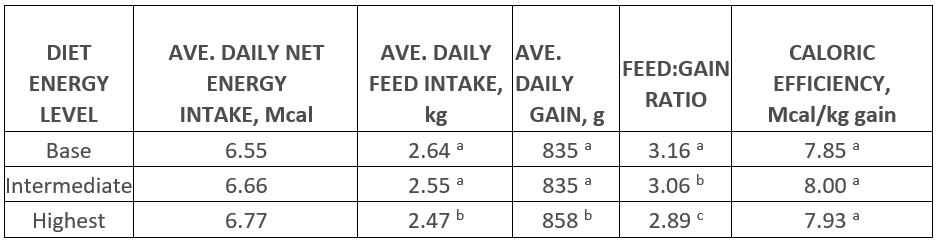
a,b,c: averages with different superscripts are significantly different at P<0.05
1) Rock Lake Research Center, Exp. S19-05, Nov., 2019
2) Test duration of 119 days, initial weight 30 kg, final weights 131-134 kg
a,b,c: averages with different superscripts are significantly different at P<0.051) Rock Lake Research Center, Exp. S19-05, Nov., 20192) Test duration of 119 days, initial weight 30 kg, final weights 131-134 kg

 16 March 2026
 2
minute read
2
minute read