

National Life Cycle Carbon Footprint Study for Production of US Swine
A report from the University of Arkansas estimates the carbon footprint for the production, preparation and consumption of one four-ounce serving of pork to be 2.48lb carbon dioxide equivalents.Executive Summary
The National Pork Board commissioned the University of Arkansas’ Applied Sustainability Center to conduct a life cycle assessment (LCA) of the US pork supply chain, with primary focus on defining greenhouse gas (GHG) emissions. GHG emissions are commonly defined in terms of the cumulative global warming potential (GWP) of all greenhouse gases emitted for a system or product, and in this case across the supply chain necessary to provide pork products to the consumer. The GHG of primary concern are carbon dioxide (CO2); methane (CH4); nitrous oxide (N2O); and refrigerants. The GWP for a system is reported as carbon dioxide equivalents (CO2e) derived by converting non-CO2 gas emissions to an equivalent ‘global warming potential’ quantity of CO2. The analysis was carried out for the functional unit of the consumption of one serving (4 ounces) of boneless pork. The system study boundaries encompassed feed production; pork production; delivery to processor; processing; packaging; distribution; retail; and consumption/disposal. The primary time frame for the study was 2008-2009.
The production system considered activities performed in support of pork production and delivery, extending to GHG burdens of raw material extraction such as fertilizer production, primary fuel extraction, delivery, combustion and, for electricity, transmission and distribution losses. The system specifically included production of polystyrene and other packaging material. Also, the impacts of distribution and refrigeration, as well as product loss through the supply chain, were included.
Raw data were provided from industry experts and standard pork industry handbooks. Regionally specific data for feed crops were taken from farm extension and the National Agricultural Statistical Service regarding the energy and GHG emissions associated with production. Additional input data for fuels and electricity consumption for crop production were obtained from the technical literature, state agricultural extension services, the US Department of Energy, the USDA, and other academic institutions. GHG emissions from manure were calculated, based on IPCC recommendations, from ASABE manure management guidelines and from the Purdue Pork Industry Handbook. Transport emissions from producer to processor and from processor to distributor were calculated from information provided from industrial sources. Cradle-to-grave contributions from packaging included production of raw materials (polystyrene, shrink wrap, paper) and ultimate disposal of the materials.
This report summarises a scan level carbon footprint analysis for a single serving of pork prepared for consumption through evaluation of GHG emissions across the entire production and delivery system with relatively low resolution and high data aggregation – that is, it is not for a specific production system, but represents an overall average of US production, processing, and distribution systems. The available life cycle data, by production stage, and the methodology for calculation of the carbon footprint are described. It was found that the major impacts of pork production occur in crop production, manure management, retail distribution and consumption.
The overall estimate of the carbon footprint for preparation and consumption of one four-ounce serving was found to be 2.48 lb CO2e with a 95 per cent confidence band from 2.2 lb CO2e to 2.9 lb CO2e. Please note that the metric system was used for all our calculations and the final results were converted to English units for presentation.
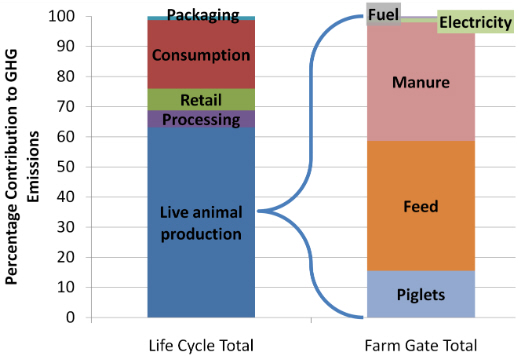
Overall, the contribution of emission burden for each stage was found to be approximately:
- 9.6 per cent: sow barn (including feed and manure handling)
- 52.5 per cent: nursery to finish (including feed and manure handling)
- 6.9 per cent: processing (5.6 per cent) and packaging (1.3 per cent)
- 7.54 per cent: retail (electricity and refrigerants)
- 23.5 per cent: the consumer (refrigeration, cooking and methane from food waste in landfill).
Additional detail of the breakdown of contributions to GHG emissions is presented in Figure 1. It should be noted that these percentages are dependent on specific baseline assumptions in the model, two important baseline assumptions are that distiller’s grains (DDGS) are included in the animal rations and that in-home preparation of the servings were for three people and a gas oven was used.

Conclusions
In conclusion, the results of this scan analysis demonstrate that the mean value for cradle to farm gate production of pork in the US is within the range reported in the literature for pork produced elsewhere in the world, and is similar to other animal proteins. The results also show that both retail and in-home electricity use for refrigeration are non-trivial contributions to the overall footprint, while processing/packaging contributes a relatively smaller amount. Based on IPCC recommended calculations, the deep pit system is preferred to anaerobic lagoons due to reduced methane production.
The issue of allocation of burdens for feeds is an important one regarding reporting of carbon footprints, and it is recommended that a standard approach for handling agricultural byproducts like soybean meal and DDGS be agreed upon across the industries involved. This national scale analysis provides a baseline GHG emissions estimate against which the sector can benchmark future reductions.
Finally, the choice of manure management system is crucial in determining the carbon footprint. The contribution of on-farm energy consumption represents about 25 per cent of the farm contribution for deep pit systems and only about 10 per cent for anaerobic lagoon systems. The resolution of this scan does not allow us to highlight clear energy saving opportunities; however, efforts at energy conservation are simultaneously good for the environment and offer potential cost savings.
The final project report was published in May 2011 and written by Greg Thoma (Ralph E. Martin Department of Chemical Engineering, University of Arkansas), Darin Nutter, (Department of Mechanical Engineering, University of Arkansas), Richard Ulrich (Ralph E. Martin Department of Chemical Engineering), Charles Maxwell (Department of Animal Sciences, University of Arkansas), Jason Frank (Diamond V, Inc., Cedar Rapids, Iowa) and Cashion East (The Sustainability Consortium, University of Arkansas).
updated April 2014


