

CME: Crop Condition Ratings Not as Bad as Expected
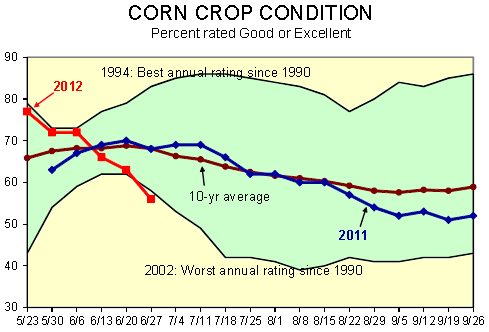
US - You know you are in trouble when things are better simply because they aren’t as bad as they were expected to be. Such is the case with the corn market this evening after USDA’s crop condition ratings came in terrible but not quite as bad as expected in today’s Crop Progress report, write Steve Meyer and Len Steiner.As can be seen below, this week’s good/excellent rating percentage of 56 per cent is 7 per cent lower than on week ago, 12 per cent lower than last year’s 68 per cent for the same week. It is also 10 per cent lower than the average of the past 10 years and even 1 per cent lower than the crop rating for this week in 2002, our worst year since 1990.


But it wasn’t quite as bad as the market expected and corn
futures are all marginally higher in electronic trading this afternoon
and evening.
Still, this corn crop is in trouble ins some important areas.
The most serious is Indiana where the share rated good or excellent
fell from 37 per cent last week to 27 per cent this week. Perhaps more important,
the share rated poor or very poor grew from 24 per cent last week
to 36 per cent this week. Illinois, the number 2 corn state behind only Iowa,
is the other state of concern as its share in the good/excellent
categories dropped 15 per cent last week to only 37 per cent. Illinois’s porr/very
poor share jumped from 13 per cent to 22 per cent this week. Nationally, 16 per cent of
acres were rated poor or very poor this week compared to 9 both
last week and one year ago.
The western Cornbelt, much of which received some
amount of rain last week, still has a large majority of acres rated
good or excellent — at least for now. Minnesota, about which we
were very concerned when planting started, is the garden spot with
83 per cent of acres in the top two categories. It is followed by North Dakota
(91 per cent good/excellent), South Dakota (71 per cent), Iowa (68 per cent) and
Nebraska (60 per cent). Missouri and Kansa are the trouble states in the
west at 34 per cent and 40 per cent Good/Excellent, respectively.
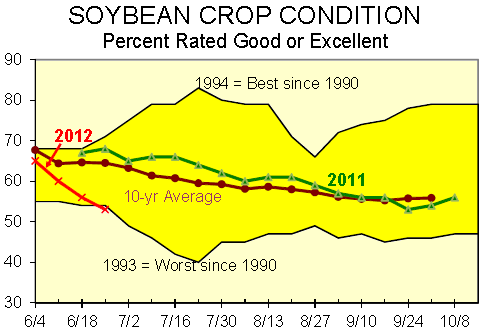
And things are no better for soybeans. This week’s 53 per cent
good/excellent share is the lowest for this week since 1988 when
the last great Midwestern drought has only 17 per cent of soybean acres
so rated for this week. Since our “worst“ in the chart above goes back
only to 1990, the 1988 data do not appear there. This week’s 53 per cent
compares to 65 per cent last year and a 10-year average of 64.5 per cent good/
excellent in week 25. It is 3 per cent lower than last week’s figure.
The trouble spots for soybeans are, as expected, virtually
the same as those for corn. Good/excellent shares dropped shrply
in Illinois (-12 per cent to 35 per cent for the week), Indiana (-8 per cent to 24 per cent), and
Michigan (-10 per cent to 49 per cent). Good/excellent shares remained above
60 per cent in Iowa, Minnesota, the Dakotas and Mississippi. AS with
corn, Missouri is the sore spot in the west with only 26 per cent of acres
rated good/excellent and 35 per cent rated poor/very poor.
But what does all of this mean for potential yields?
The answer is “Not much“ if one looks at the historical relationships.
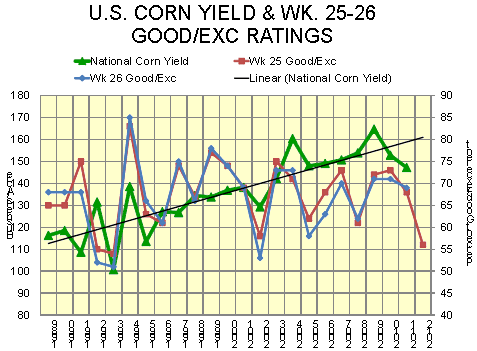
The chart below shows final annual yields as well as
week 25 and week 26 good/excellent crop percentages. We present
two weeks simply because this crop is farther along than normal
and comparing to week 26 may be more appropriate.

There are clearly years with poor ratings and good yields
(1992, 2005, 2008) and with good ratings and poor yields (1991,
1997). The correlations are abysmal with week 25’s correlation to
final yield being 0.3236 and week 26’s being 0.2879. 1992 and
1993 are the only two other years that really compare to this year
at this time and one of them saw a yield roughly 11 bushels higher
than trend while the other saw a yield over 20 bushels lower than
trend. The latter, 1993, was of course a year of flooding and extremely
wet conditions on millions of acres that did not flood. Do
we really compare it to a year of dry, hot conditions?
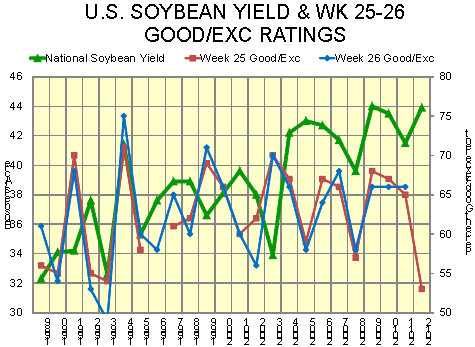
The story for soybeans is much the same — as can be
seen in the chart below. The correlations here are a bit
better (0.3963 for week 25, 0.33236 for week 26) but nothing close
that anything we would want to take a risk on.
Obviously — Many things could yet change!


