New Study Report: US pork industry making sustainability progress
On-farm data shows continuous improvement 21 September 2020
 2 minute read
 By:
By: 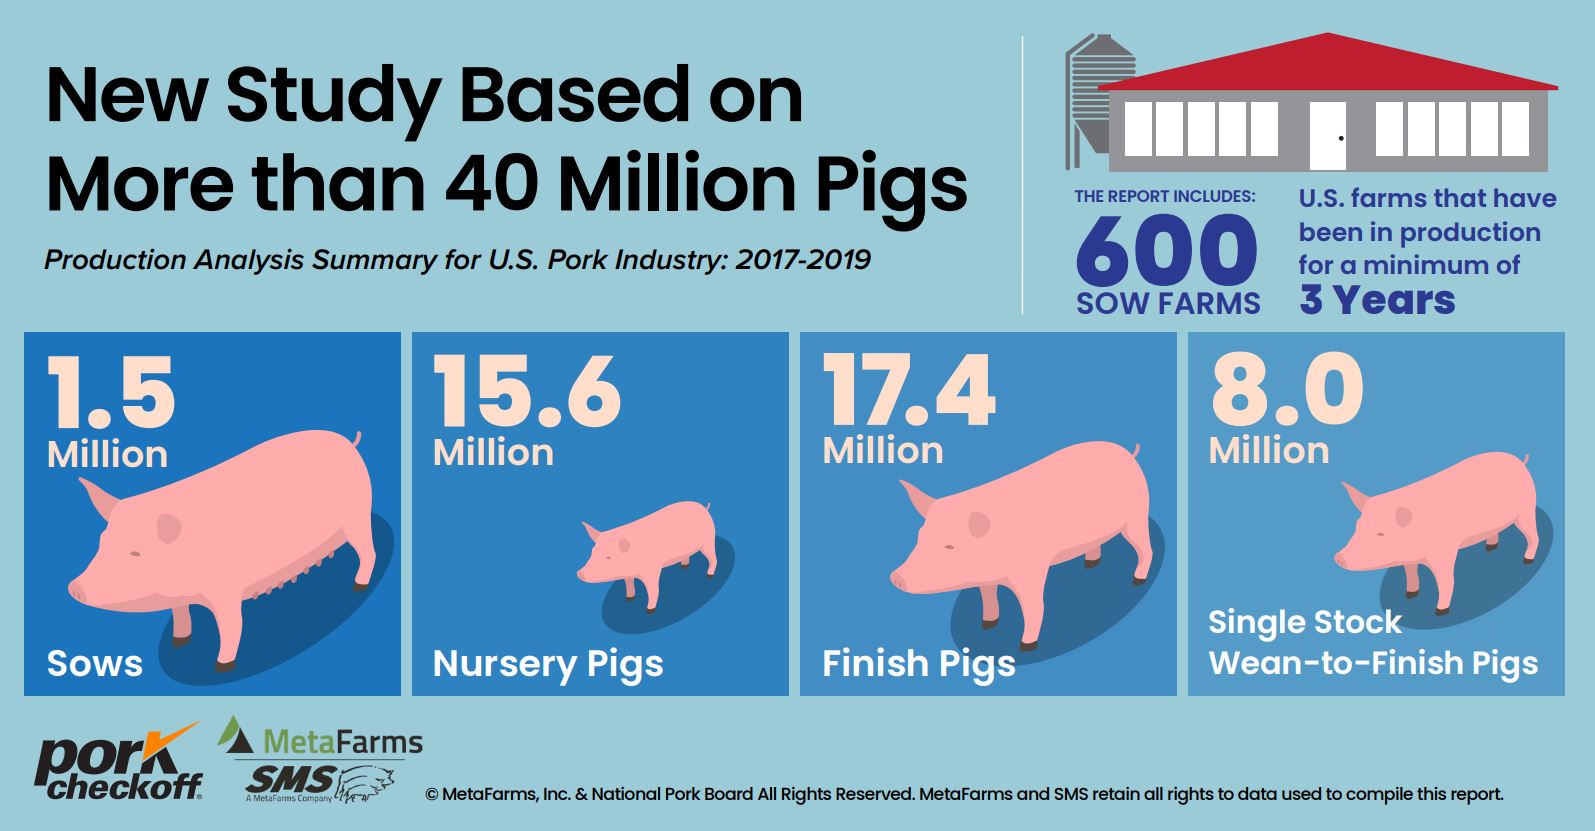
The new study released by the National Pork Board, Production Analysis Summary for U.S. Pork Industry: 2017-2019, shows that pig farmers continue to tackle sustainability by being more efficient every day.
The 15-page report, prepared by Minnesota-based MetaFarms and its subsidiary SMS (Swine Management Services), looked at sow, nursery, finish and wean-to-finish data over a three-year period. The results reconfirmed long-term trends of increasing efficiency, which has the additional benefit of reducing production costs — an especially welcome conclusion in 2020.
“One of the greatest benefits of this Pork Checkoff-funded study is the benchmarking ability it offers producers who always want to improve their efficiencies,” said Chris Hostetler, animal science director for the Pork Board. “It’s also a great way to show today’s consumers that America’s pig farms are becoming more efficient all the time and that pork is a sustainable choice when it comes to choosing a protein.”
Brad Eckberg of MetaFarms and Ron Ketchem of SMS, helped analyze much of the data in the study.
“The ability to benchmark allows producers to compare their production numbers to other farms and systems, regardless of what record program they are using, what genetics they have or their farm size,” said Ketchem, a longtime industry number cruncher. He continues to be surprised by the increasing range of production numbers between farms year after year.
“Every year, more variation occurs with new highs and lows being set,” he said. “This shows the impact in genetics and the ability of producers to manage their farms daily.”
When producers are looking at benchmarking and at ways to improve, Ketchem offers these rules of thumb:
- Farrowing rate: A 1% change in farrowing rate equals a 0.34 pig increase or decrease in pigs weaned/mated female/year. Example: A change of 4% in farrowing rate equals an increase or decrease of 1.36 pigs weaned/mated female/year.
- Piglet survival: Based on 15 total pigs born per litter, a change of 1% in piglet survival equals a 0.36 increase or decrease in pigs weaned/mated female/year. Example: A change of 4% piglet survival equals an increase or decrease of 1.44 pigs weaned/mated female/year.
- Female death loss: A 1% change in female death loss equals a 0.25 pig increase or decrease in pigs weaned/mated female/year. Example: A change of 4% in female death loss equals an increase or decrease of one pig weaned/mated female/year.
Key productivity indexes (KPIs) are used throughout the analysis of sow, nursery, finish and wean-to-finish data to draw attention to specific areas of focus within production stages. The retrospective study, the eighth of its kind funded by the Pork Checkoff since 2011, breaks the KPIs into a month-to-month format to show the effects of seasonality on the data. The findings also identify possible improvements in genetics, nutrition, health, management practices, among other areas.
According to Hostetler, the goal of the study’s production analysis is to aid the pork industry in improving profitability, which has to be part of the sustainability equation. “We hope that producers will dig into the specific parts of this study and use it to help improve their own farm businesses,” he said. “If you’re happy with your numbers in one area of production, look at another area and see where more progress can be made. It’s all about getting a little better every day.”

Sarah Mikesell
Sarah Mikesell grew up on a five-generation family farming operation in Ohio, USA, where her family still farms. She feels extraordinarily lucky to get to do what she loves - write about livestock and crop agriculture. You can find her on LinkedIn.