

New Pig Farm Record Analysis System
Gerard McCutcheon from Oak Park and Shane Brady from Ballyhaise explained the new Teagasc PigSys recording system and how it can be used to monitor and improve pig performance and profitability at the Teagasc Pig Farmers Conference in October 2013.Keeping accurate records of performance is a critical component of managing any business. Good records allow targets to be set and are useful in examining the factors to be considered if targets are not achieved.
The Teagasc PigSys record system has been upgraded in 2013 and is now part of the Teagasc eProfit Monitor (ePM) System. The benefits of the new system are:
- More prompt assessment of performance trends in the 'national' herd
- Individual farmers can access their records/reports as it is a web-based system
- These reports compliment other recording systems being used on many pig farms.
There are a number of items that need to be taken into account in the new systems.
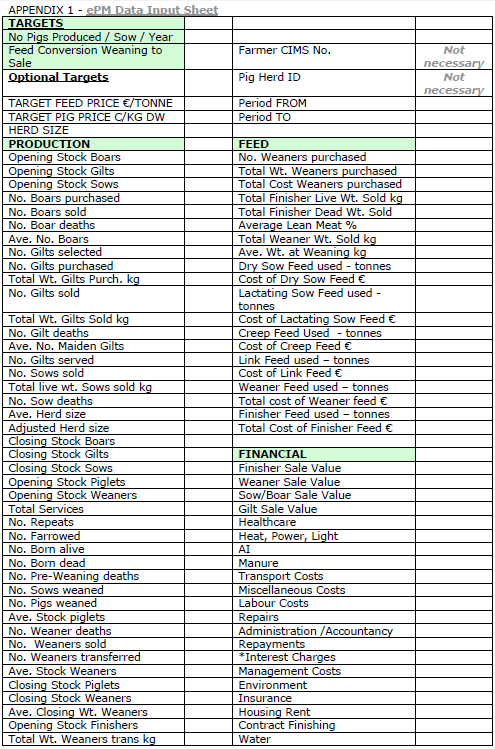
The Data Input Sheet:
It is important to ensure that there is no overlap of dates between one data set and the next. The new system will reject the data set if this occurs. The Lean Meat per cent must have a figure of 0 to 100 per cent. All cells in the input sheet apart from two, must be populated with a figure even if that is zero.

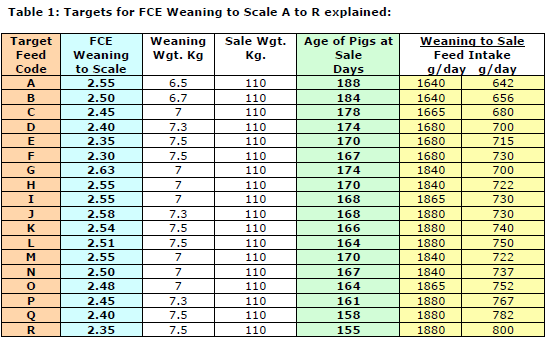
There are now two 'Mandatory Targets' on the Data Input Sheet. There must be an entry in for each of these two targets. The first Mandatory Target is for the 'Number of Pigs Produced/Sow/Year' – this ranges from 22 to 32 at present. The second compulsory Target is 'Feed Conversion Weaning to Sale'. This is listed as A to R with the associated feed conversion efficiency (FCE) and average daily gain (ADG) figures shown in Table 1.

It is important to choose the correct target for your unit based upon the unit’s previous performance and realistic goals.
There are three 'Optional Targets'. These are useful if you want all possible Target figures populated in the Target Column of the Pig Detailed Report and Sensitivity Analysis Report.
The Target Herd Size is most important if you want the Target number of services and farrowings / week shown.
The Value of the Stock categories has also been updated for 2013 data and future data sets. Table 2 shows the value of each category which will be reflected in the 'Stock Valuation' on page 4 of the Pig Detailed Report.

The Default value of the Average Closing Weight of Weaner is 20kg (same as PigSys) while the Average Closing Weight of Finisher is now 70kg (up from 58kg in PigSys). This is to reflect the increase in finisher sale weight on farms.
ePM Reports:
There are three main reports generated on the Teagasc ePM. These are as follows.
- Pig Input Data Report
- Pig Detailed Report
- Benchmark Report
These reports give a very good assessment of the performance on the unit.
Pig Input Data Report: This shows the input data as uploaded for your unit. This is a useful report to see trends in performance figures over a number of data sets.
Pig Detailed Report: This is quite similar to the PigSys report that most producers are familiar with. There are a number of new items now included.
The first new parameter in this report is 'kg of pig meat/sow/year'. This is calculated by multiplying the number of Pigs/Sow/Year by the Average Dead Weight by the per cent Finishers sold (at bottom of page 4 of Report). Obviously this figure is comparable for integrated units selling all pigs as finishers but will be of less value if there is a per cent of pigs sold as weaners.
The second new item in the Pig Detailed Report is the 'tonnes of feed /sow/year'. This is calculated by adding the total tonnes of all feed used in the data set and dividing it by the Average Herd Size and annualising the figure.
These two items will allow units see how they are performing in terms of the 2 tonne from 7 (tonnes of feed) target. This target is a benchmark that allows you see how your unit performance compares with other pig farms at a national and international level.
The financial section of this report has also been updated and is worth examining.
Benchmark Report: This is a useful report to compare your performance (in the most recent data set) with the national average, the top 25 per cent and the top 10 per cent of producers in the country.
There is also a Sensitivity Analysis Report which should be discussed in conjunction with your Adviser. The figures and layout of this report need to be discussed and understood before you show them to any external party.
The Teagasc ePM system is a web based system. Every pig producer may access their records on the Teagasc ePM once they are logged onto the system. To do this you need to know your PPS number and password. You will need to talk with your Adviser to get registered on the system. This will allow access to your records once you have access to the internet.
Lastly, there is the facility to look at the asset value and net worth of your business by completing a couple of extra screens. This is an area that some units may wish to look at in greater detail. It is certainly worth a discussion with your Adviser.
Benchmarking Performance
The parameter 'kg of pig meat/sow/year' is worth looking at for a number of countries. We are behind our European counterparts as shown in Table 3.

The kg of feed/kg of carcase shows the Netherlands with the best overall FCE (3.41) which was reflected in the Dutch pig farmers having the best feed cost of €1.03 per kg deadweight.
Conclusion
There are pig units in Ireland that are competitive by comparison to the figures shown above for other countries.
All farms need to measure their own performance and should not be afraid to benchmark their results against other producers. This new Teagasc Recording system is available to all Irish pig producers as part of the Teagasc/IFA Pig Joint Programme.
December 2013


