Effects of Swine Manure Applications on Soil Nutrient Levels and Phosphorus Loss Risk
Robert Koehler, Ann Lewandowski and John Moncrief of Minnesota State University report the results from a south-west Minnesota monitoring project and the application of the Minnesota Phosphorus Index. 17 January 2014
 24 minute read
 By:
By: Concerns with Land Application of Swine Manure
Many areas in Minnesota have seen rapid and sweeping changes in swine production practices in the past decade (Elias Morse, 2001). Structural changes in the industry have resulted in numerous large swine finishing buildings with liquid manure stored in under-slat pits. The manure is periodically land-applied, usually in the fall after soybeans and before corn in the typical corn-soybean rotation.
There are some concerns that nitrogen, phosphorus and trace elements in the manure may build up in the soil to problematic levels. Nitrogen (N) losses to tile drainage systems and ground water are controlled primarily by setting application rates to match the N needs of the first crop following application. Appropriate application practices also account for season and temperature, soil type, potential carry-over N from previous years and geology.
Phosphorus (P) loss to lakes and streams is associated with elevated soil P levels, direct P losses from manure, and especially with high erosion rates related to steep slopes, proximity to water body, and some tillage practices. Elevated soil P levels are often caused by a history of excessive manure application.
The amount of N relative to P in manure is usually less than that required by most crops, including corn. Thus, when manure is applied at a rate estimated to meet N requirements, P may be applied in excess of the crop P requirements. This may be partially offset in the common corn-soybean rotation when manure is not applied during the soybean year and the soil phosphorus level is drawn down somewhat. The amount of P used and P availability are affected by soil, climate, and crop yield.
Manure contains several heavy metals and other elements. Some are micronutrients that are essential to plant growth. Compared to other types of manure, swine and poultry manure have higher levels of copper (Cu) and zinc (Zn) because these nutrients are added to feed (Augenstein et al., 1994). Soil levels of Cu and Zn may build up after long term or heavy manure applications. Excessive levels of Cu and Zn can induce deficiencies of iron and other nutrients (Marschner, 1995; Tisdale et al., 1993).
Swine manure applications are unlikely to cause soil levels of Cu and Zn that are toxic to plants. The level of soil copper and zinc at which plants are affected is variable and depends on plant species, pH, organic matter, and levels of other metals and nutrients (Chaney, 1993). Borkert et al. (1998) identified critical soil levels of 10 ppm Cu (Mehlich-3) for corn, 43ppm Zn for soybeans and 185ppm Zn for corn1. Tucker et al. (2005) stated that critical toxic levels for plants that are not unusually sensitive are 60ppm for Cu and 120ppm for Zn (Mehlich-3). Some US and Minnesota agricultural soils are above these levels (Holmgren et al., 1993; Linden et al., 1995). Levels of 1 to 3ppm Cu and 4 to 8ppm Zn on sites with long-term dairy manure applications were measured by Schmitt (1999).
The US Environmental Protection Agency (USEPA) does not restrict biosolid applications based on Cu and Zn until the material has more than 1,500mg per kg of Cu or 2,800mg per kg of Zn (USEPA, 1994). Swine manure is typically enriched to about 1,000mg per kg for both Cu and Zn (Chaney, 1993). Cumulative application limits for a plot of land are 1,500kg of Cu or 2,800kg of Zn per acre (1,335 and 2,492 lbs/ac).
1Original data from Borkert et al. were 17 mg Cu/ dm3, 70 mg Zn/dm3, and 300 mg Zn/dm3. Conversions to ppm assumed soil bulk density of 1.4.
Accuracy in reaching targeted nutrient application levels with manure can be challenging because of
- variation in the forms and quantities of nutrients,
- challenges in calibrating equipment,
- use of equipment not designed for low-rate application,
- lack of sufficient acres to apply at appropriate rates, and
- practical constraints that compel producers to apply manure using less-than-optimal methods or timing.
Also, producers may try to ensure an adequate N supply by using an estimate of N availability that is lower than general recommendations, and thus will calculate higher manure rates.
Southwest Minnesota Monitoring Study
Description of the monitoring sites
Since 1998, a county water planning committee in southwest Minnesota has funded an ongoing on-farm monitoring project in cooperation with Bob Koehler (Extension Educator-Livestock Systems at the Southwest Research and Outreach Center).
The objective is to study the potential for nutrient build-up in soils with swine manure applications to better understand the impact of the swine finishing operations typical of those built in the mid-1990s.
Manure and soil nutrient levels have been monitored in nine fields that receive biennial liquid swine manure applications originating from six deep-pitted, slatted-floor, swine finishing barns and one slatted-floor nursery barn. Fields are in a corn-soybean crop rotation with manure injected every other year after soybean harvest. Seven sites have been sampled since the fall of 1998. Two sites were added in 1999 and one was dropped after 2004.
Study methods
Approximately one acre in each field is sampled annually in the fall just before harvest, with 16 probes comprising the sample. Samples are taken to a seven-inch depth. The sample areas are identified by the number of paces from a permanent landmark and samples follow a grid pattern also measured by paces. Soil is tested for soluble salts, pH, phosphorus, potassium, sulphur, zinc, iron, manganese, copper, boron, calcium and magnesium.
Four sites (Fields 1, 4, 7, and 9) started with very high P levels. The high P levels are probably associated with a history of manure application but long term records are not available to confirm this. The remaining fields had very low or low soil test P levels in 1998.
Manure and nutrient application rates for each field site are shown in Table 1. Manure was tested for total N, ammonium N, P and potassium (K). Before 2001, applications were made with a drag-hose technology typical for that time, which did not allow for low-rate applications. Thus, application rates were higher than commonly recommended, and were higher than rates applied since 2001 when applicators started using slurry tankers. Average rates with the drag hose were 6,050 gallons per acre, resulting in the application of 262lbs per acre of estimated available N and 188lbs per acre of phosphate (P2O5). Application rates with the slurry tanker declined over the period and averaged 4,180 gallons per acre, resulting in the application of 189lbs per acre of estimated available N, and 140lbs per acre of phosphate. Modifications to equipment, including the addition of flow controllers, will make rates just above 3,000 gallons per acre possible beginning in 2006.
Manure nutrient tests were used to estimate daily nutrient production per pig.
| Table 1. Manure application rates Manure was injected with a drag hose from 1998 through 2000, and with a slurry tanker beginning in 2001. | ||||||||
|---|---|---|---|---|---|---|---|---|
| Field | Year | Fall manure | N | P2O5 | K2O | Avail. Na | P2O5 | K2O |
| (gal/ac) | --------- (lbs/1000 gal)--------- | --------- (lbs/ac) --------- | ||||||
| 1 | 1999 | 5400 | 59.5 | 39.0 | 43.5 | 258 | 211 | 236 |
| 2001 | 4200 | 54.0 | 41.0 | 39.0 | 181 | 172 | 164 | |
| 2003 | 4200 | 58.3 | 34.0 | 36.7 | 196 | 143 | 154 | |
| 2005 | 4000 | 61.5 | 31.0 | 40.5 | 197 | 124 | 162 | |
| 2 | 1999 | 5400 | 59.5 | 39.0 | 43.5 | 258 | 211 | 236 |
| 2001 | 4200 | 54.0 | 41.0 | 39.0 | 181 | 172 | 164 | |
| 2003 | 4200 | 58.3 | 34.0 | 36.7 | 196 | 143 | 154 | |
| 2005 | 4000 | 61.5 | 31.0 | 40.5 | 197 | 124 | 162 | |
| 3 | 1999 | 5400 | 61.0 | 31.5 | 43.5 | 264 | 171 | 236 |
| 2001 | 4200 | 71.5 | 59.0 | 43.5 | 240 | 248 | 183 | |
| 2003 | 4250 | 72.5 | 45.5 | 41.0 | 247 | 193 | 174 | |
| 2005 | 4000 | 51.0 | 32.5 | 31.0 | 163 | 130 | 124 | |
| 4 | 1998 | 5400 | 56.0 | 22.0 | 33.0 | 242 | 119 | 178 |
| 2000 | 4450 | 63.0 | 43.0 | 42.0 | 224 | 191 | 187 | |
| 2002 | 4200 | 52.0 | 34.5 | 34.5 | 176 | 146 | 146 | |
| 2004 | 4100 | 57.0 | 26.0 | 42.0 | 188 | 107 | 173 | |
| 5 | 1998 | 5400 | 56.0 | 22.0 | 33.0 | 242 | 119 | 178 |
| 2000 | 4450 | 63.0 | 43.0 | 42.0 | 224 | 191 | 187 | |
| 2002 | 4200 | 52.0 | 34.5 | 34.5 | 176 | 146 | 146 | |
| 2004 | 4100 | 57.0 | 26.0 | 42.0 | 188 | 107 | 173 | |
| 6 | 2000 | 5700 | 76.5 | 49.5 | 46.5 | 348 | 281 | 264 |
| 2002 | 4200 | 70.0 | 46.5 | 43.0 | 235 | 195 | 181 | |
| 2004 | 4200 | 64.5 | 34.0 | 40.0 | 218 | 144 | 169 | |
| 7 | 1998 | 7500 | 49.5 | 25.5 | 28.5 | 297 | 191 | 214 |
| 2000 | 8750 | 42.0 | 26.5 | 24.5 | 294 | 232 | 214 | |
| 2002 | 4200 | 43.0 | 24.0 | 27.5 | 145 | 101 | 116 | |
| 2004 | 4200 | 56.0 | 19.5 | 36.5 | 189 | 82 | 154 | |
| 8 | 1999 | 7450 | 38.5 | 20.0 | 25.0 | 230 | 149 | 187 |
| 2001 | 4200 | 37.5 | 26.0 | 31.0 | 126 | 109 | 130 | |
| 2003 | 4200 | 57.0 | 33.5 | 33.0 | 196 | 142 | 139 | |
| 9 | 1999 | 7200 | 46.0 | 27.0 | 33.0 | 264 | 194 | 237 |
| 2001 | 4200 | 52.0 | 34.5 | 30.0 | 175 | 145 | 126 | |
| 2003 | 4200 | 50.0 | 24.0 | 29.5 | 169 | 101 | 125 | |
| 2004 | 4250 | 45.0 | 27.0 | 33.0 | 153 | 115 | 140 | |
| Average | 4836 | 56 | 33 | 37 | 215 | 157 | 174 | |
| Avg. (drag host) | 6045 | 262 | 188 | 213 | ||||
| Avg. (slurry tank) | 4177 | 189 | 140 | 153 | ||||
| a Available N is calculated as 80% of total N (Schmitt, 1999). | ||||||||
Monitoring results
Manure nutrients
Liquid manure nutrient data are shown in Table 2 and Table 3. Nitrogen levels in the liquid manure ranged from 44 to 70 pounds per 1,000 gallons when averaged by barn for the seven- to eight-year monitoring period. Ammonium-N was more than 80 per cent of total N, which is higher than published values of 50 per cent to 75 per cent (Lorimor et al., 2004). Nearly 100 per cent of ammonium-N and only about 30 per cent of organic-N is available to crops in the first year. Thus, with a high proportion of ammonium, the availability of total N in this manure is likely to be slightly higher than the University of Minnesota recommended estimate of 80 per cent, which assumes average proportions of ammonium and organic-N (Schmitt, 1999). As application technology allows for lower manure rates to match crop N needs, it becomes more important to accurately estimate N availability.
| Table 2. Manure trace elements | ||
|---|---|---|
| 2006 manure test (dry weight) | Estimated annual application (lb/ac/yr)a | |
| Calcium | 35,000 mg/kg | 32 |
| Magnesium | 19,000 mg/kg | 17 |
| Sodium | 22,000 mg/kg | 20 |
| sulphur | 9,000 mg/kg | 8.6 |
| Copper | 230 mg/kg | 0.2 |
| Iron | 2,553 mg/kg | 2.3 |
| Manganese | 574 mg/kg | 0.5 |
| Zinc | 1,821 mg/kg | 1.7 |
| a Assumes 4800 gallons per acre applied every other year and 2006 manure nutrient levels. | ||
| Table 3. Manure test results Average of two barns at each site for seven or eight years. | ||||||||||
|---|---|---|---|---|---|---|---|---|---|---|
| Site | Manure test per 1000 gallons | Rate per acre (applied alternate years) | ||||||||
| Dry matter (%) | N (lbs) | Org.-N (lbs) | NH4*-N (lbs) | P2O5 (lbs) | K2O (lbs) | Manure (1000 gals) | Avail. Na (lbs) | Total P2O5 (lbs) | Annual excess Pb (lbs P2O5) | |
| A | 5.5 | 58 | 9.0 | 49 | 35 | 39 | 4.4 | 203 | 156 | 28 |
| B | 4.9 | 53 | 8.2 | 41 | 29 | 31 | 5.2 | 189 | 148 | 23 |
| C | 6.8 | 67 | 12.9 | 54 | 45 | 41 | 4.7 | 251 | 211 | 55 |
| D | 3.6 | 47 | 7.1 | 40 | 25 | 29 | 5.5 | 200 | 142 | 21 |
| Mean | 5.2 | 56 | 9.3 | 46 | 33 | 35 | 4.9 | 21. | 164 | 32 |
| SD | 1.3 | 8.1 | 2.7 | 6.3 | 8.3 | 5.5 | 0.5 | 29 | 33 | 17 |
| a Available N is assumed to be 80% of total N (Schmitt, 1999). b Assume 60 lbs P2O5 removed by corn crop and 41 lbs P2O5 removed by soybean crop. |
||||||||||
Phosphate levels averaged 35lbs per 1,000 gallons of manure before phytase was added to diets and averaged 28lbs per 1,000 gallons after phytase was added starting in 2004. For all sites over all years, the average annual application of P was 79lbs phosphate per acre and year. A lower rate in 2004 and 2005 of 58lbs phosphate per acre and year reflects the combination of declining manure application rates and lower P concentration in manure.
These values are somewhat higher than the expected annual P removal rate of 51lbs phosphate per acre and year, which assumes 190-bushel corn at 0.34lbs phosphate removed per bushel and 45-bushel soybeans at 0.82lbs phosphate removed per bushel (USDA). With the use of dietary phytase, P applications would equal crop removal if 3,500 gallons per acre of manure were applied in alternate years. At this rate, estimated available N applications would be 160lbs per acre.
Average copper and zinc content of the manure in 2006 was 230mg Cu per kg and 1,800mg Zn per kg of manure (dry weight). Reported typical levels are 1,000mg Cu per kg and 1,000 to 2,000mg Zn per kg (Clemson University, 2006; Chaney, 1993).
At 4,800 gallons of manure per acre, application rates would be 0.42lbs Cu per acre and 3.3lbs Zn per acre. These rates are far below EPA annual limits of 67lbs Cu per acre and 125lbs Zn per acre, and cumulative limits of 1,335lbs Cu per acre and 2,492lbs Zn per acre (USEPA, 1994).
Nutrient production by swine
Nutrient production per pig was estimated for each barn based on records of gallons pumped and average manure test values (Table 4). Total phosphate production was slightly lower than published values (Lorimor et al., 2004). The use of dietary phytase beginning in 2004 reduced P production per pig by 26 per cent.
| Table 4. Estimates of daily amnure and nutrient production per animala | |||
|---|---|---|---|
| Average over all barns | Published values | Monitored sites compared to published values | |
| Manure (gallons) | 0.91 | 0.89 | 102% |
| Nitrogen hauled (pounds) | 0.052 | 0.047 | 111% |
| Nitrogen excreted (poundsc) | 0.065 | 0.059 | 111% |
| P2O5 hauled (pounds) | 0.031 | 0.036 | 86% |
| K2O (pounds) | 0.032 | 0.036 | 97% |
| a 2001-2005 data. Assumed 670,000 pig-days per 2000-head capacity site and average animal weight of 150 lbs. bFrom Lorimor et al., 2004, Table 7 for wet/dry feeders (annual production per pig space/365 days). c Assumed 20% of N is lost in storage. |
|||
Soil phosphorus
 |
 |
Soil phosphorus levels varied substantially from year to year, rising an average of 5ppm Olsen-P in the year after manure application and falling the following year.
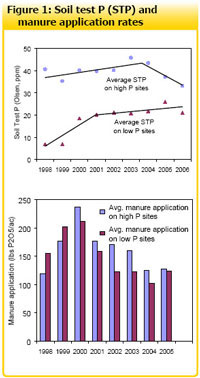
Over the nine-year study, the five fields that started with low P levels rose from about 6ppm Olsen-P and appear to have stabilised at about 22ppm (Figure 1).
Over nine years, soil test P levels in individual plots have not exceeded 36ppm on any of the fields with initially low P.
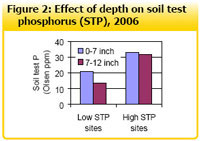
This declining rate of build-up of soil test P could be explained by high tie-up of P by the calcareous soils or by the movement of P down through the soil below the sampling depth. Downward P movement is consistent with the observation that soil test P is less stratified in the sites with initially high soil test P, which are thought to have a history of manure application (Figure 2).
Manure applications increase the solubility and downward movement of P (von Wandruszka, 2006). The average soil test P increase for all sites was 1.2ppm Olsen-P per year. The increase for fields with initially low soil test P was 2.0ppm per year. Increases were higher during the first four years following higher manure application rates (Table 5).
| Table 5. Change in soil test P | |||
|---|---|---|---|
| Manure rate | Change in soil test P | ||
| low P site | high P sites | ||
| 1998 to 2001 | 188 lbs P2O5/ac | 5.1 ppm/yr | 0.2 ppm/yr |
| 2002 to 2006 | 140 lbs P2O5/ac | 0.5 pp/yr | -2.3 ppm/yr |
Soil trace elements
Levels of trace elements have been variable from year to year but no trends have been apparent (Table 6).
| Table 6. Soil properties (average over all sites and years) | |
|---|---|
| pH | 6.9 |
| Soil organic matter | 5.2% |
| Boron | 1.3 ppm |
| Calcium | 3,590 ppm |
| Copper | 2.2 ppm |
| Iron | 66 ppm |
| Magnesium | 633 |
| Manganese | 17 ppm |
| Phosphorus (Olsen) | 27 ppm |
| Potassium | 199 ppm |
| Soluble salts (E.C.) | 0.30 mmhos/cm |
| sulphur (So4-S) | 9.2 |
| Zinc | 3.1 ppm |
Using the Minnesota Phosphorus Index to Analyze Swine Manure Applications
Description of the Minnesota Phosphorus Index
The Minnesota Phosphorus Index (MN P Index) is a tool designed to estimate the relative risk of P loss from farm fields (Lewandowski et al., 2006). It is a decision-support tool that allows users to evaluate management alternatives that may reduce this risk.
The MN P Index is not intended to be used as a regulatory tool nor to estimate changes in surface water quality measurements. The MN P Index programme, user guide and technical guide are available on-line (http://www.mnpi.umn.edu).
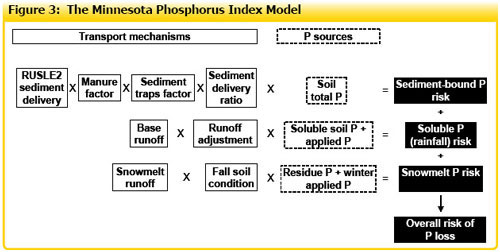
The MN P Index model considers three pathways of P movement across the landscape (Figure 3). The first is the transport of sediment-bound P associated with the eroded particles in rainfall runoff. The second is the transport of dissolved P by rainfall run-off. The third is the transport of P by spring snow-melt.
Losses from these three pathways are added, giving a total P index (unitless) for the given site. This index value represents the relative long-term average risk of P losses for a given site and set of management practices.
Inputs to the MN P Index include soil type, distance to surface water, crops, tillage systems and manure and fertiliser P application amounts and methods. Erosion rates are an important input and are calculated by the P Index using the RUSLE2 erosion prediction model.
Analysis methods
The MN P Index (version 1.3) was used to estimate P loss risk from the monitoring sites (Table 7), and to determine what factors most affect P loss risk by testing P loss risk from a typical range of Minnesota hog farms (Table 8).
The typical farms were examined by testing a base or average scenario. Alternative values for each input were then varied one at a time to determine the size of their independent effect on MN P Index results.
P Index results
Monitoring sites
Rotation average P loss risk estimates were low or very low for all of the monitoring sites (Table 7). This shows that swine manure can be applied in these landscapes in a manner that does not threaten water resources with excess P.
Phosphorus loss risk was highest on sites 7 and 8 due to higher erosion because of steeper slopes and tillage oriented up-and-down the slope. Even when erosion does occur on these landscapes, sediment is often deposited before it reaches surface water because of the long distance between the field and the nearest ditch or stream, or because of ponding occurring around tile inlets.
The MN P Index estimates that soil test P will rise at a rate of about 1ppm Olsen-P per year, so manure applications at this rate will have only small effects on soil test P and on long term P loss risk.
| Table 7. MN P Index inputs and results for monitoring sites | |||
|---|---|---|---|
| Average for the 9 sites* | Minimum | Maximum | |
| Inputs | Drainage: Subsurface drainage tile will open surface inlets, 42% of field drains to inlets | 15% | 80% |
| Soil type: Webster cl, Clarion I, Nicollet cl | coarser soils on site 1 | 6% | |
| Slope: 3% | 1% | 6% | |
| Initial soil test P: 21 ppm Olsen | 6 ppm Olsen | 55 ppm Olsen | |
| P buffer category: Fine textured soils | Sites 3,7, and 8 were calcareous | Site 1 was course textured | |
| OM: 5.3% | 4.9% | 6.3% | |
| Tillage orientation: Cross slope | Site 8 was up-and-down slope | ||
| Distance to water: 5,955 ft. | 2,640 ft. | 10,560 ft. | |
| Cropping system: Alternating years of corn (175 bu) and soybeans (45 bu) Fall chisel plow, spring field cultivate No P fertilizer or fall anhydrous N 5% to 20% residue cover after planting corn; greater than 2-% after planting soybeans |
|||
| Manure: Alternate years, fall injected after soybeans 157 llbs P2O5/ac | 82 lbs P2O5/ac | 281 lbs P2O5/ac | |
| Results | Sediment del. (RUSLE2): 1.2 t/a/y | 0.4 t/a/y | 2.5 t/a/y |
| Total P Index: 0.8 | 0.6 | 1.1 | |
| Particulate P pathway: 0.2 | 0.1 | 0.4 | |
| Soluble P pathway: 0.5 | 0.4 | 0.6 | |
| Snowmelt pathway: 0.1 | 0 | 0.1 | |
| * Sites 1-7: 1998 to 2005. Sites 8-9: 1999 to 2005 | |||
| Table 8: MN P Index inputs for testing typical hog farm scenarios | ||
|---|---|---|
| Input category | Base scenario values | Alternative values |
| Time period | 2 years | 20 years |
| Sediment traps | none | |
| Inlets | Surface contributing area=50% | |
| Tillage orientation | Cross slope | |
| Distance to water | 300 ft | |
| Initial soil test | 20 ppm Olsen | 5 ppm Olsen |
| 5% OM | 150 ppm Olsen | |
| Soil type | 102b Clarion l | 33B Barnes loam (9% slope) 86 Canisteo cl (calcareous) 96a collinwood sic 141a Egeland sl |
| Slope crops tillage | After both crops: | After soybeans: |
| After both crops: | Fall disk/Spring field cultivor | |
| Spring field cultivate | Fall strip till, Spring no tillage, Fall no tillage, Spring field cultivator, Fall chisel, spring field cultivator | |
| Manure application | Injected in fall before corn | Winter before corn |
| Manure rate | 175 lbs P2O5/ac | 90 lbs P2O5/ac, and 300 lbs P2O5 |
| Residue cover | >20%, 5-20% | |
Effects of individual variable on P loss risk
P loss risk estimates for scenarios where only one variable is changed at a time show the sensitivity of the P loss risk to each variable.
Soil type
P loss risk was somewhat elevated on the Collinwood soil because of its lower hydraulic conductivity. Hydraulic conductivity is a measure of how readily water moves through the soil. Lower hydraulic conductivity means lower infiltration into the soil and higher runoff and P loss over the surface. Soluble P loss risk in the years when manure was applied was double that of the other soils with more typical hydraulic conductivity.
Soil type can also affect erosion rates, but had little effect in these scenarios. Slope gradient and length and management factors were more important in determining erosion rates.
Soil test P
Soil test P affects the risk of sediment-bound P losses and the risk of soluble P loss.
Sediment-bound P loss risk doubled between the low and high P soils (5ppm Olsen-P versus 150ppm Olsen-P) in the test scenarios. Because of the low erosion rates, a doubling of risk is inconsequential in these scenarios but would be important where erosion rates are high or on land near waterways.
Soluble P loss risk (relative P Index value) attributable to soil solution was near zero for the low soil test P soil and 0.5 for the high soil test P soil. For comparison, soluble P loss risk attributable to partially incorporated manure adds another 2 index units. In other words, although high soil test P soils have high soluble P losses, direct P losses from manure can be more important.
Long term phosphorus build-up
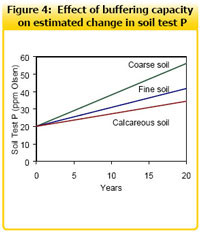 |
The soil test P of some soils will increase more than that of other soils in response to the same amount of added manure. For example, the coarse Egeland soil has a lower buffering capacity than the calcareous Canisteo soil and thus will have a higher soil test P after 20 years of manure applications (Figure 4). The build-up of soil P is especially important where erosion rates are high or on land near surface water2.
Calcareous soils are common in southwest Minnesota. Calcium precipitates with P making it unavailable to plants and unavailable to be dissolved and lost in run-off. However, P bound to sediments can be carried to surface water by erosion. Once in stream and lake beds, the P may eventually become available to aquatic organisms and lead to eutrophication. For this reason, the MN P Index considers total soil P - not just crop available P - when estimating the risk of sediment-bound P loss.
Distance to water
P loss risk of a field 300 feet from water was half the risk of the same field 10 feet from water. Risk of P loss from a field 2,000 feet from water was two-thirds that of a field 300 feet from water. These differences would be important where erosion rates are elevated.
Manure rate and method
 |
Manure application rate can be the most important determinant of overall P loss risk because surface-applied manure is vulnerable to direct losses of dissolved P that can be much greater than dissolved P from soil.
In the test scenarios, the application rate was increased by 70 per cent from 175 to 300lbs phosphate per acre. The overall risk of P loss was dominated by this change, increasing by 60 per cent during the manure application year and by 50 per cent over the two year rotation.
In contrast, if manure is injected, almost none is left exposed to runoff and even high manure application rates will have little short-term effect on P loss risk. Over the long term, high application rates, regardless of application method, will increase P loss risk by increasing soil test P.
Tillage
Reducing tillage and tilling across a slope reduces erosion rates and thus P loss risk. However, most of these scenarios already had low erosion rates because of the small slope gradients. Therefore, tillage had much more effect on snow-melt losses than on sediment P losses.
Winter manure application
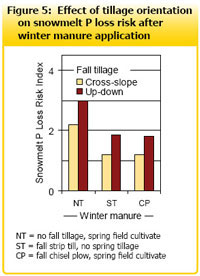
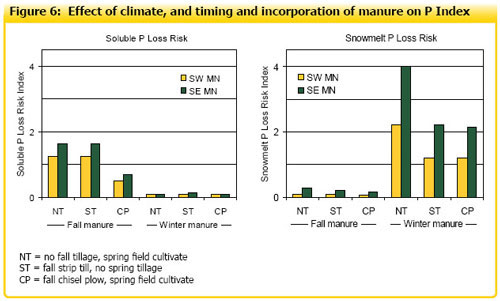
Liquid hog manure is rarely applied in the winter but other types of manure may be winter-applied. Because of relatively low snow-melt rates in southwestern Minnesota, winter applications have acceptable P loss risk in this scenario, except when there is no fall tillage or tillage runs up and down the slope. Up-and-down slope tillage in the fall before winter manure application increases P loss during spring snow-melt by one-third to one-half compared to cross-slope tillage (Figure 5). P loss risk is substantially higher if the same cropping system is applied in southeast Minnesota where average rainfall runoff is about 33 per cent higher and snow-melt run-off is 75 per cent higher (Figure 6).
Summary
Monitoring sites observations
- Soil test P did not increase linearly. Soil test P in fields originally testing low for P increased significantly after the first few manure applications and then increased only slowly from subsequent applications. Soil test P in fields originally testing high for P increased only slowly from manure applications.
- Per pig nutrient production estimated from manure test and gallons produced was similar to daily production estimates from MWPS (Lorimor et al., 2004).
- The proportion of ammonium to organic N was higher than typical values, making the total N slightly more available in the first year than commonly estimated.
- Manure application rates have trended downward over the observation period because of improvements in and adoption of manure application technology including the use of a tanker in place of a drag hose and improved controller equipment.
- With lower application rates (3,500 gallons per acre) and the use of dietary phytase, manure P application will not exceed two-year crop removal estimates for P.
- Trace mineral levels in the soil have not changed significantly over the observation period.
Phosphorus index observations
- Based on the MN P Index, the monitoring sites pose minimal risk of P delivery to the nearest water bodies.
- P loss risk from swine manure applications primarily depends on the rate and method of application. P loss risk can be minimized by controlling erosion, avoiding winter manure applications, limiting rates for any single manure application to the equivalent of about 200lbs phosphate per acre, and limiting total applications over several years to amounts that prevent build-up of excessive soil P. The limit on single application rates will be lower if manure is not incorporated and in places with higher run-off, such as on soils with poor infiltration or in higher-rainfall regions of the state.
- Soil test P increases are moderate at N-based manure application rates.
- Soil test P levels depend on soil type. The elevated calcium carbonate levels in many soils of southwest Minnesota tend to buffer soil against soil test P increases. Although less available to plants, the P is still in the soil and can be carried via erosion to surface water.
- The MN P Index is useful for assessing the relative risk of P loss associated with animal agriculture in Minnesota. The Minnesota Phosphorus Index allows users to examine the effect of multiple P loss risk factors to estimate site-specific risk.
References
Augenstein, M.L., L.J. Johnston, G.C. Shurson, J.D. Hawton, and J.E. Pettigrew. 1994. Formulating farm-specific swine diets. University of Minnesota Extension Service BU-06496. Available online at http://www1.extension.umn.edu/agriculture/swine/formulating-farm-specific-swine-diets/index.html
Borkert, C.M., F.R. Cox, and M.R. Tucker. 1998. Zinc and copper toxicity in peanut, soybean, rice, and corn in soil mixtures. Communications in soil science and plant analysis 29(19- 20):2991-3005.
Chaney, R.L. 1993. Zinc phytotoxicity. p. 135-150. In: A.D. Robson (ed.) Zinc in Soils and Plants. Kluwer Academic Publishers, Dordrecht.
Clemson University Cooperative Extension Service. 2006. Certification Program for Animal Manure Managers. Available online at http://www.clemson.edu/camm/ (Verified Mar 28, 2006).
Elias Morse, D. 2001. A Description of Animal Agriculture in Minnesota. Technical work paper prepared for the Generic Environmental Impact Statement on Animal Agriculture and the Minnesota Environmental Quality Board. Available online at http://www.eqb.state.mn.us/geis/TWP_Description.pdf, link from http://www.manure.umn.edu/ or http://www.eqb.state.mn.us/geis/index.html (verified June 6, 2006).
Holmgren, G.G.S., M.W. Meyer, R.L. Chaney, and R.B. Daniels. 1993. Cadmium, lead, zinc, copper, and nickel in agricultural soils of the United States of America. J. Environ. Qual. 22:335-348.
Lewandowski, A., J. Moncrief, and M. Drewitz. 2006. The Minnesota Phosphorus Index: Assessing Risk of Phosphorus Loss from Cropland. University of Minnesota Extension Service AG-BU-08423. Available online at http://www.mnpi.umn.edu
Linden, D.R., W.E. Larson, R.H. Dowdy, and C.E. Clapp. 1995. Agricultural Utilization of Sewage Sludge. Minnesota Agricultural Experiment Station, Bulletin 606-1995.
Lorimor, J., W. Powers, and A. Sutton. 2004. Manure characteristics: manure management systems series: MWPS 18, section 1, second edition. Midwest Plan Service, Iowa Sate University.
Marschner, H. 1995. Mineral Nutrition of Higher Plants, 2d ed. Academic Press, London.
Minnesota Phosphorus Index Web Site. http://www.mnpi.umn.edu (A source for the program, user guide, technical guide, and other support materials.)
Schmitt, M.A. 1999. Manure Management in Minnesota. University of Minnesota Extension Service FO-03553. Available online at http://www.extension.umn.edu/distribution/cropsystems/DC3553.html (verified Sept 20, 2006).
Sharpley, A.N., W.J. Gburek, G. Folmar, and H.B. Pionke. 1999. Sources of phosphorus exported from an agricultural watershed in Pennsylvania. Agricultural Water Management 41:77-89.
Tisdale S.L., W.L. Nelson, J.D. Beaton, and J.L. Havlin. 1993. Soil Fertility and Fertilizers, 5th ed. Macmillan Publishing Company, New York.
Tucker, M.R., D.H. Hardy, and C.E. Stokes. 2005. Heavy metals in North Carolina soils: occurrence and significance. Raleigh: North Carolina Department of Agriculture and Consumer Services, Agronomic Division. Available at: http://www.ncagr.com/agronomi/hflyer.htm (Verified June 14, 2006).
US Department of Agriculture (USDA). Crop Nutrient Tool. (to calculate nutrients removed by harvest) http://npk.nrcs.usda.gov/
US Environmental Protection Agency (USEPA). 1994. A Plain English Guide to the EPA Part 503 Biosolids Rule. Available online at http://www.epa.gov/owm/mtb/biosolids/503pe/
Von Wandruszka, R. 2006. Phosphorus retention in calcareous soils and the effect of organic matter on its mobility. Geochemical Transactions 7:6.
January 2014