

Monitoring Farrowings and Farrowing Intentions in 'Hogs and Pigs' Report
More pigs and more pig meat look likely to appear on the US market in 2015 than last year, forecasts Lee Schulz in the current 'Iowa Farm Outlook'.Significant attention perpetually surrounds possible changes in breeding herd inventories in the US hog industry. Retail pork supplies are heavily dependent on breeding herd production decisions, namely the retention of gilts as replacements and the holding of sows for further breeding service as these decisions, along with commensurate pigs per litter, dictate the size of subsequent pig crops.
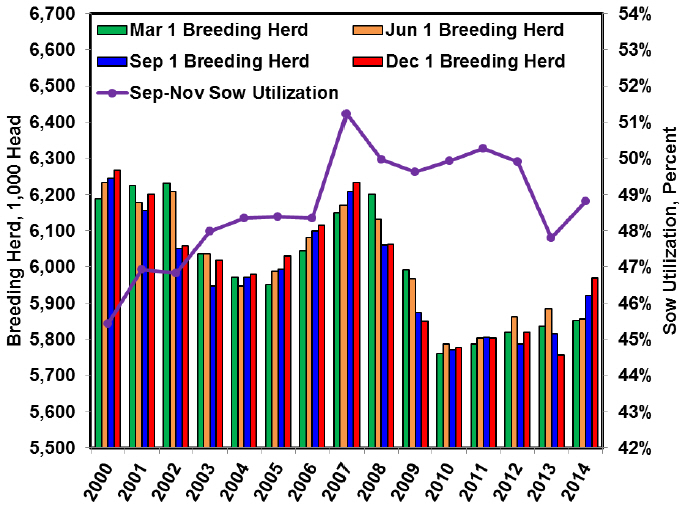
USDA’s December 'Hogs and Pigs' report suggests growing prospects of expansion. The breeding herd inventory, at 5.969 million head, was up 3.7 per cent compared to one year ago. This is the largest breeding herd inventory since June 2009 (Figure 1).
Breeding herd additions totalled 49,000 head during the September-November period. Sow utilisation, September-November farrowings / September 1 breeding herd, at 48.8 per cent was higher than 2013 (47.8 per cent) and approaching the 2008-12 average (49.9 per cent). With breeding herd inventories and sow utilisation trending higher many factors are pointing towards expansion in the hog industry.

(Data Source: USDA-NASS)
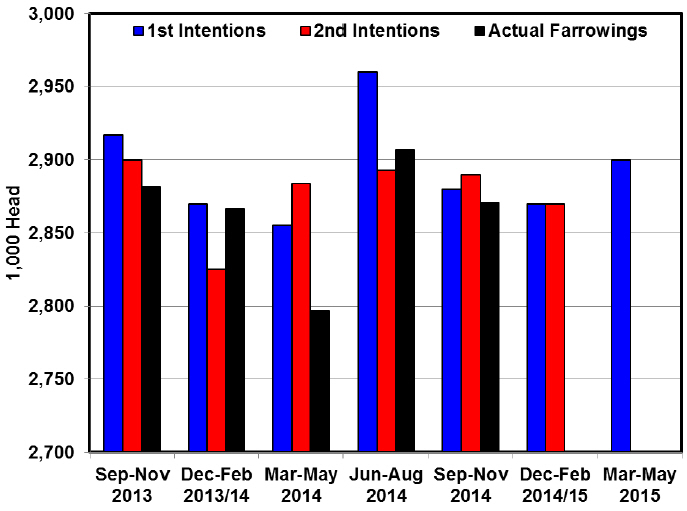
Actual farrowings and farrowing intentions are a primary indicator of hog supplies. As part of the USDA Hogs and Pigs report producers are asked their farrowing levels for the previous quarter and farrowing intentions over the next two quarters. For example, the quarterly report released December 23, 2014 gave the second farrowing intentions of 2,870,000 head for the quarter December-February of 2014/15. The first farrowing intention for the next quarter, March-May of 2015, was reported at a level of 2,900,000 head. These intentions can be compared to actual farrowing levels from the previous quarter or year to identify general trends in supply. Second intentions can be compared to first intentions to gauge any adjustments to price signals and/or production capability that occurred in recent months.
Actual farrowings during the September-November 2014 quarter of 2,871,000 head were below the first and second intentions for that quarter (Figure 2). Generally, pigs are slaughtered about six months or two quarters after being farrowed. Thus, fewer hogs will be marketed in the March-May 2015 quarter than had earlier been anticipated.
The second intentions for the December-February 2014/15 quarter were the same as the first intentions for that quarter. December-February 2014/15 sows farrowing, at 2,870,000 head, would be up 3.9 per cent compared to a year ago. Therefore, producers have remained optimistic about profit prospects and maintained expansion plans.
The first intentions for the March-May 2015 quarter can be compared to the previous quarter or to the same quarter a year earlier. The level of intentions says producers are increasing supplies relative to the previous quarter and increasing supplies to an even larger degree compared to levels realized a year earlier.

(Data Source: USDA-NASS)
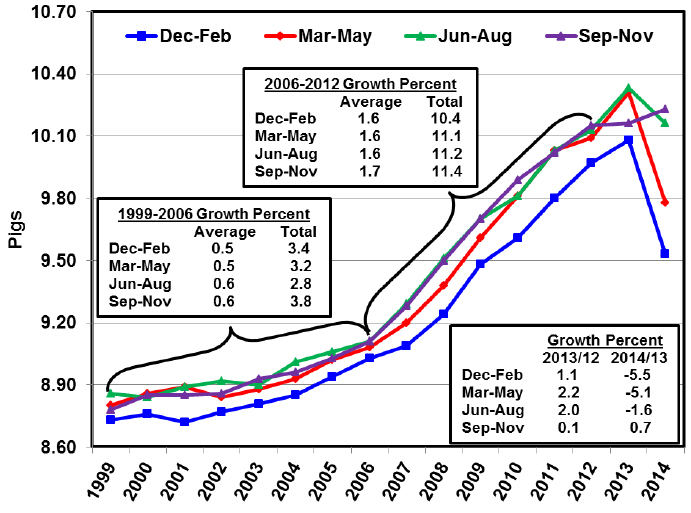
Pig crop variability is an additional factor that influences hog supplies. Both farrowing levels (number of litters) and farrowing performance (pigs saved per litter) determine pig crops. The September-November pigs saved per litter estimate, at 10.23 pigs, was up 0.7 per cent compared to a year ago and a return to a more “normal” productivity level but one well short of the 1.6 per cent growth rate that been seen from 2006 to 2012 (Figure 3). The September-November sows farrowing, at 2.871 million head, was up 3.3 per cent. Thus netting a 4.0 per cent increase in the September-November pig crop compared to a year ago.
Pig crops in a “pipeline approach’ can be used to estimate supplies. The current inventory of pigs less than 50 pounds, at 19.026 million head, was up 3.5 per cent and the inventory of pigs 50 to 119 pounds, at 16.630 million head, was up 3.4 per cent compared to a year ago. Pig inventory weighing 120 to 179 pounds, at 12.635 million head, was up 0.5 per cent while inventory weighing 180 pounds and over, at 11.791 million head, was down 1.5 per cent.
Projecting farrowing intentions out with commensurate pigs per litter it looks like the potential is there for new record highs for the December 2014- February 2015 and March-May 2015 pig crops.
None of this is guaranteed but current estimates are that pipeline pig supplies are larger and the industry is going to have more sows farrowing and improving farrowing performance, and therefore more pigs and more pork pounds that show up on the market in 2015.

(Data Source: USDA-NASS)
January 2015


