Survey of PPV and SE shows vaccination failure on Canadian farms
Researchers from Hipra recommend a revision of vaccination protocols following the discovery of vaccination failures on Canadian farms. 10 July 2019
 5 minute read
 By:
By: Introduction
The protective role of specific antibodies against Swine Erysipelas (SE) and Porcine Parvovirus (PPV) enhanced through vaccination is key to control infectious reproductive problems in breeders [1]. Therefore, the presence of gilts and sows seronegative to SE and PPV in vaccinated farms causes great concern among farmers; this is generally considered a marker of poor vaccination practices or low vaccine efficacy [2]. The present study was meant to survey the serological status of mature gilts and sows on Canadian farms implementing vaccination against the above-cited pathogens.
Materials and Methods
Eleven farms vaccinating against SE, PPV and Leptospira spp. (trivalent vaccines) from Canada, located in Alberta, Ontario and Saskatchewan provinces were recruited. Sera samples were collected according to table 1; between one and three farms in each cluster do not submit any sample or those were incorrectly submitted. Samples were then tested by ELISA to determine the presence of antibodies against SE by an in house assay (BIOVET, Canada) and PPV by INgezim PPV Compac (Ingenasa). All samples were taken from breeders (gestating gilts and sows) around 80 days of gestation, with the complete vaccination protocol.
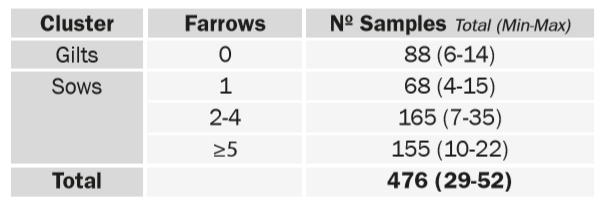
Herd sampling. Min-Max means the minimum or maximum number of samples submitted per farm for each cluster
Results
Results showed presence of seronegative subpopulations of breeders in sampled farms with the highest incidence among gilts. This problem was particularly evident when the antibody response against PPV was examined. Seronegative breeders were highly present among vaccinated gilts (53.6±37.5 percent) and to a lesser extent among sows with 2-4 farrowing (8.3±13.5 percent).
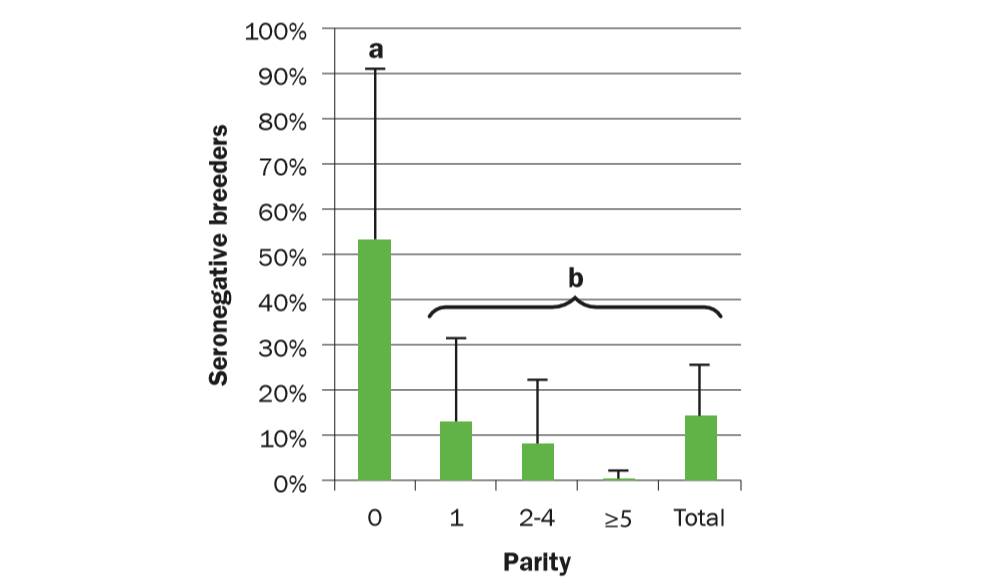
Antibody response against PPV in sows of different parity; results are represented as average and standard deviation of the percentage of negative breeders per farm. Different letters denote a statistical significant difference (Mann-Whitney U test; p<0.05).
In contrast, the problem was less evident when the antibody response against SE was examined. Low percentage of seronegative breeders was detected and these were mostly present among vaccinated gilts (12.3±10.8 percent).
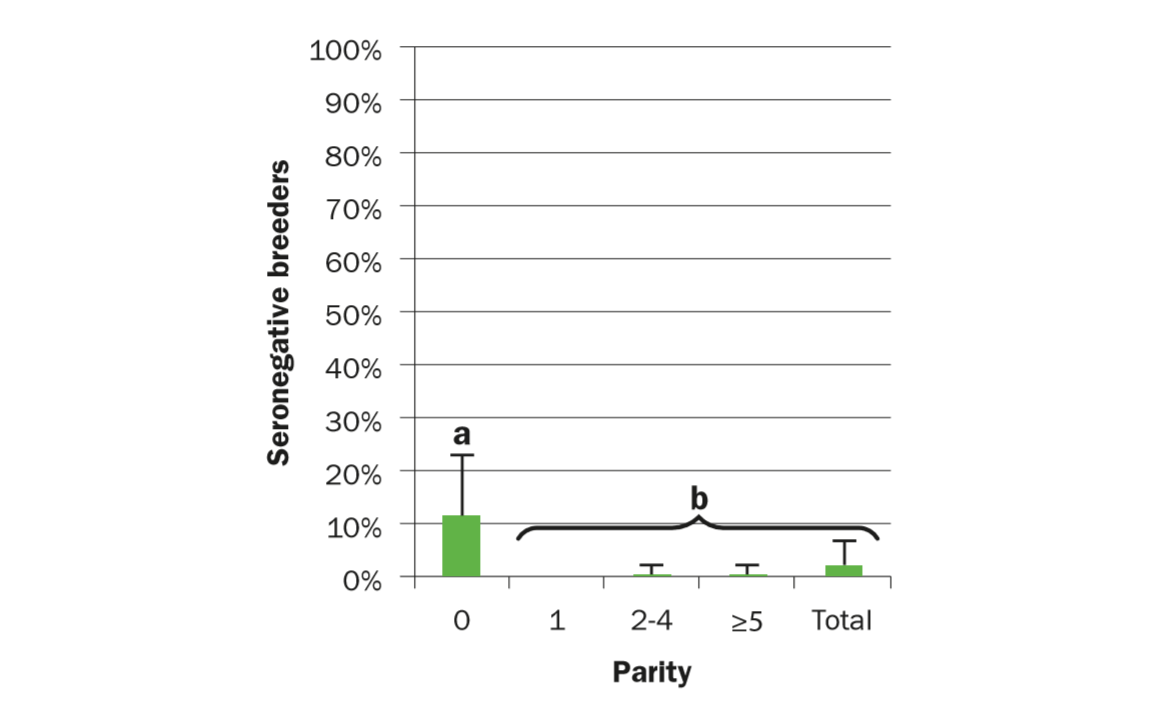
Antibody response against SE in sows of different parity; results are represented as average and standard deviation of the percentage of negative breeders per farm. Different letters denote a statistical significant difference (Mann-Whitney U test; p<0.05).
Finally, data was crossed to study the relationship between SE and PPV responses in gilts. Interestingly, the percentage of gilts positive to both pathogens was 29.5 percent. Moreover, a disagreement between PPV and SE results was found (Cohen’s kappa, k=0.031). Considering that used vaccines were trivalent, these results might suggest disequilibrium between the immune response induced by PPV and SE antigens contained in the same vaccine or a significant circulation of SE in studied farms.
Conclusions
Results might suggest weaknesses in currently implemented vaccination protocols in the Canadian pork industry. Therefore, vaccine’s protocols or/and vaccines used should be revised or changed. However, the importance of the presence of these subpopulations of seronegative gilts and sows in the herd immunity needs to be elucidated.
| References | ||||
|---|---|---|---|---|
| [1] Shimoji Y | ||||
| (2000) | Microbes Infect 965-972. | |||
| [2] Giménez-Lirola LG. et al. | ||||
| (2012) | J Microbiol Methods, 91: 73-79. |