

Canadian Hog Statistics - Fourth Quarter 2010
By Statistics Canada. The numbers of pigs produced in 2010 and of sows on 1 January this year in Canada were lower than the comparable figures from a year previously but there is some evidence that the declines are slowing considerably.Highlights
Hog inventories on 1 January 2011 were reported at 11.9 million head, up slightly (0.6 per cent) from 1 January 2010.
There were 1.3 million sows and gilts reported on 1 January 2011, 1.1 per cent fewer than one year earlier and down 5.5 per cent from the same date two years ago. Sow inventories in 2010 have not been at this level since 1999, which was the start of a five-year industry-wide expansion.
Hog exports were reported at 5.7 million head in 2010, continuing the declining trend that has been seen since peaking in 2007. Exports in 2010 were down 10.1 per cent from 2009.
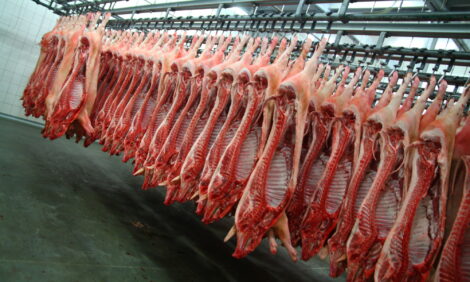
Domestic hog slaughter totalled 21.3 million head in 2010, down 2.4 per cent from 2009. Hog slaughter in the fourth quarter 2010 is down 2.4 per cent from the same quarter in 2009.
Analysis
Hog inventories were still declining on a year-over-year basis in early 2010 but inventories appear to have reached some stability in the recent quarter. Hog inventories on 1 January 2011 were reported at 11.9 million head, up slightly (0.6 per cent) from 1 January 2010. Although a very small increase, this is the first time since 1 April 2006 that there has been any increase on a year-over-year comparison.

The breeding herd continued to decline in 2010 with no signs of rebuilding in the near future. There were 1.3 million sows and gilts reported on 1 January 2011, down 1.1 per cent from one year earlier and down 5.5 per cent from the same date two years ago. Sow inventories in 2010 have not been at this level since 1999, which was the start of a five-year industry-wide expansion. Sows expected to farrow in the first quarter 2011 are down 1.4 per cent from the same period in 2010, while sows expected to farrow in the second quarter are up 0.7 per cent.

Domestic hog slaughter totalled 21.3 million head in 2010, down 2.4 per cent from 2009. Hog slaughter in the fourth quarter 2010 is down 2.4 per cent from the same quarter in 2009. Hog exports were reported at 5.7 million head in 2010, continuing the declining trend that has been seen since peaking in 2007. Exports in 2010 were down 10.1 per cent from 2009, down 38.8 per cent from 2008, and down 42.9 per cent from the peak in 2007. The Country of Origin Labelling (COOL) regulation was introduced in the US in the fall of 2008.

Hog slaughter prices strengthened in the later half of 2010. The farm product price index for hogs indicates that hog prices in the second half of 2010 reached levels not seen since 2005. The profitability of hog producers is directly affected by grain prices. As grain prices increase, hog producer margins decrease. Overall grain prices in 2010 were much lower than the previous year and the record prices reached in 2008.

Further Reading
| - | You can view the full report by clicking here. |
February 2011


