Do L-Lys sulfate and L-Lys HCl impact pig diets differently?
The development of L-Lys sulfate has given pork producers and swine nutritionists an alternative to L-Lys HCl as a source for supplementing dietary lysine – typically the first limiting amino acid in diets for swine. 16 December 2019
 8 minute read
 By:
By: L-Lys HCl had previously been the only option to meet the nutritional requirements for lysine in swine diets in an economic manner since it was developed over 50 years ago.
Several studies have demonstrated the equivalency in bioavailability of L-Lys sulfate and L-Lys HCl in nursery pigs (Evonik Nutrition & Care GmbH, 1998; Liu et al., 2007; Palencia et al., 2018) and early finishing pigs (Htoo et al., 2016) despite the changes in composition of L-Lys sulfate through the years. However, there is still a need to evaluate the relative bioavailability (RBV) of L-Lys sulfate to L-Lys HCl in the early growing and finishing pigs close to market weights. In addition, the effect of lysine source on carcass characteristics as well as the impact of lysine sulfate on dietary sulfur (S) digestibility compared to L-Lys HCl still needs to be addressed.
The objectives of this experiment were to:
- determine the effect of L-Lys sulfate on sulfur digestibility compared to L-Lys HCl,
- validate that carcass trait of pigs fed L-Lys sulfate or L-Lys HCl do not differ, and
- evaluate the RBV of L-Lys sulfate compared to L-Lys HCl based on growth performance responses for approximately 25 to 53 and 75 to 125 kg pigs.
Materials and methods
Animals and management
The experiment was conducted at the Swine Nutrition Farm at Iowa State University, located west of Ames, Iowa, USA. A total of 280 growing pigs (L337 x Camborough, PIC, Hendersonville, TN) with an average initial BW of 25.9 ± 0.25 kg were used in a 112 day growth trial. Pigs (140 barrows and 140 gilts) were placed into one of 56 pens (5 pigs/pen). Pens were randomly assigned to one of 7 dietary treatments with 8 replicates per treatment. The average initial pig body weight (BW) was equalized across treatments. Barrows and gilts were separately housed and balanced among treatments. Pigs were monitored daily, fed ad libitum, and had free access to water from nipple drinkers.
The feeding program for this study included 4 dietary phases:
- Phase 1 lasted for 4 weeks (BW from 25.9 to 47.5 kg).
- Phase 2 lasted for 3 weeks, and the pigs received a common diet to allow them to reach 75 kg.
- Phase 3 lasted for 5 weeks (BW from 67.5 to 98.2 kg).
- Phase 4 lasted for 3 or 4 weeks, to allow pigs to reach market weight (approximately 112 kg BW, two cuts at d 105 and d 112).
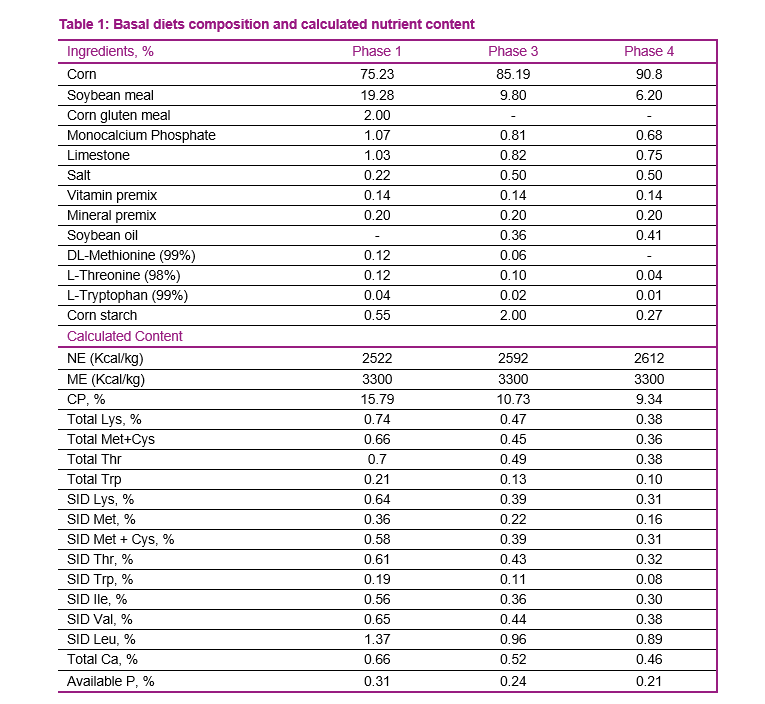
The basal diet for phase 1, 3, and 4 was lysine deficient. The standardized ileal digestible (SID) lysine content in the basal diet was set at roughly 65 percent of the requirement (Table 1). The three incremental levels of supplemented lysine provided approximately 75, 85, and 95 percent of the lysine requirements for pigs in each of the phases (Table 2).
For the purpose of illustration, the three incremental levels were represented as level 1, 2, and 3 through the report. Diets were formulated based on corn and soybean meal. Incremental levels of lysine were achieved using L-Lys HCl (78.8 percent purity) or L-Lys sulfate (54.6 percent purity). L-Lys HCl and L-Lys sulfate were included in the diets at the expense of cornstarch in order to keep the diet composition consistent across all treatments. The diets were formulated on the basis of analyzed Amino Acid (AA) content and SID coefficients of AA provided by AMINODat® 5.0 to meet or exceed net energy (NE) and AA requirements, except for lysine. In phase 3, titanium dioxide (indigestible marker) was included in the diets that contained the highest lysine level (0.27 percent L-Lys HCl and 0.38 percent L-Lys sulfate) to determine sulfur digestibility.
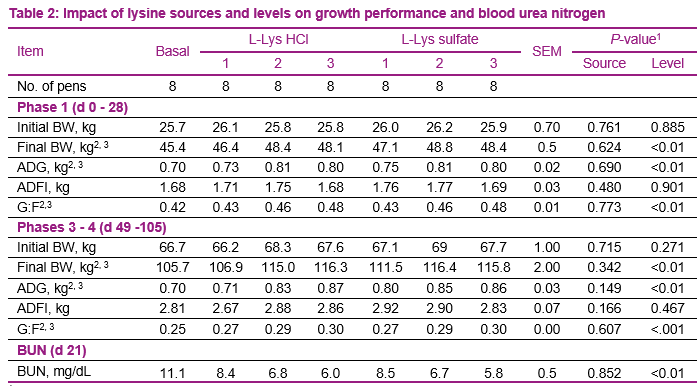
1. Interactions between source and level were not significant for all the responses (P ≥ 0.236).
2. Difference between non-supplemented (basal) and supplemented lysine diets (P ≤ 0.01).
3. Linear effect due to lysine supplementation (P≤ 0.02), quadratic effect was not significant for any of the variables (P≥ 0.1).
Data Collection
Pigs within pens were weighed at the beginning and at the end of each phase and before reaching market. Pigs were sent to market in two groups, on day 105 and 112. Feed intake of the pen was measured from the difference of daily feed additions and the weight of remained feed at the end of each phase and before pigs reaching market. Feed intake was not recorded during phase 2.
Pig BW, Average Daily Growth (ADG), Average Daily Feed Intake (ADFI), and gain to feed ratio (G:F) were calculated on a pen basis. Blood samples were collected from 2 pigs per pen on day 21 to determine blood urea nitrogen (BUN). For the carcass evaluation, all pigs were slaughtered at Tyson Foods in Perry, Iowa. Parameters recorded included hot carcass weight (HCW), backfat, and loin depth, using a fat-o-meter probe between the third and fourth last ribs (7 cm off the midline).
Fecal samples were collected for 3 consecutive days, approximately from day 7 to 10, after pigs started the phase 3 diets. The samples were collected from pens that received the diets with titanium dioxide. Fecal samples and feed were analyzed for dry matter, titanium dioxide, and sulfur content in duplicates at Iowa State University to determine sulfur digestibility.
Statistical Analysis
Factorial Design
Data were analyzed using PROC GLM of SAS (Version 9.4; SAS Inst. Inc., Cary, NC). For growth performance, pen was used as the experimental unit. For carcass performance, pen was used as the experimental unit. Days to market was used as a covariate in the statistical model analysis for HCW. HCW was used as a covariate in the statistical model for backfat, loin depth, and lean percent. The model tested for fixed effects of lysine sources (HCl vs. sulfate), levels of supplementation (0.1, 0.2, and 0.3 percent), and their interaction in a complete randomized design. The basal diet was specified as the non-supplemented lysine diet (0.0 percent of supplemental lysine). Orthogonal contrast comparison was conducted to determine the effect of lysine supplementation. Linear and quadratic effects were also evaluated for lysine levels (0.0, 0.1, 0.2, and 0.3 percent). Results were considered significant if P-values were < 0.05 and were considered tendencies when P-values were 0.05 ≤ P < 0.10.
Multivariate linear regression
Linear regression was carried out on ADG and G:F using solution clparm in the model-option in PROC GLM of SAS. Lysine level and source were used as the predictor variables. The treatment means of ADG and G:F were used as the observed values to fit the linear regression. The ADG and G:F of the basal diet were set as the common initial point for both lysine sources. The data were fitted in a multivariate linear regression model using the following equation:
Y = b0 + b1*x1 + b2*x2
where Y is the response variable (ADG, G:F), b0 is the intercept, b1 is the slope for response due to L-Lys HCl in the diet, x1 is the percent supplemental L-Lys HCl in the diet, b2 is the slope for response due to L-Lys sulfate in the diet, and x2 is the percent supplemental L-Lys sulfate in the diet. The bioavailability of L-Lys sulfate, considering L-Lys HCl as 100 percent available, was calculated by the slope ratio technique (b2/b1*100) with the 95 percent confidence interval (CI). The 95 percent CI was estimated using Fieller’s theorem that accounts for the covariation of the slopes of the two lysine sources.
Results and discussion
Diets
The analyzed content of lysine in the diets demonstrated that dietary treatments were in accordance with the formulations (Table 2). Calculated total lysine was very similar compared to analyzed total lysine for all of the treatments in all of the phases.
Health Status
A total of 9 pigs died throughout the duration of the study. Mortalities were necropsied and pigs were positive for A. suis and Pasteurella. During phase 2, an influenza outbreak occurred. In addition, a group of pigs in the trial was PRRS virus positive; however, they did not show clinical signs.
Growth, Carcass Performance, and Sulfur Digestibility
Calculated total lysine was very similar compared to analyzed total lysine for all of the treatments in all of the phases, with the average difference being only -0.01 percent unit (data not shown). Addition of lysine sources to diets deficient in lysine improved (P ≤ 0.01) BW, ADG, and G:F during phase 1 and phase 3 and 4 (Table 2). No interactions between lysine source and level of supplementation were observed (P ≥ 0.880). Additionally, there were no differences between lysine sources on growth performance. Increasing lysine levels improved BW, ADG, and G:F in a linear manner (P ≤ 0.01), regardless of the lysine source. Likewise, BUN decreased (P ≤ 0.01) as lysine level increase, but not differences were observed between lysine sources.
For carcass traits, pigs that received the diets supplemented with lysine reduced (P ≤ 0.01) back fat thickness (Table 3), this was observed regardless of the lysine source. No main effect due to lysine level and lysine source were observed for HCW, dressing percent, loin depth, and lean percent. No interactions due to lysine source and level of supplementation were observed.
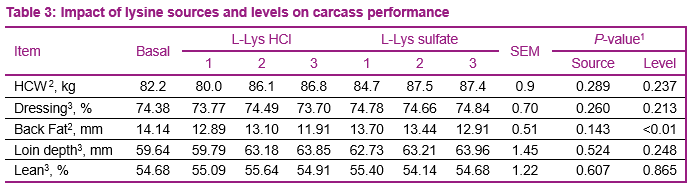
1 Interactions between source and level were not significant for all the responses (P ≥ 0.256).
2 Linear effect due to lysine supplementation (P≤ 0.01), quadratic effect was not significant for any of the variables (P≥ 0.1).
3 Difference between non-supplemented (basal) and supplemented lysine diets (P ≤ 0.01).
For digestibility of DM and S, feed samples for phase 3 with the highest Lys level and fecal samples were analyzed for DM and S content. Diet containing L-Lys HCl had 89.14 percent DM and 0.085 percent S, and diet containing L-Lys sulfate had 88.97 percent DM and 0.084 percent S. Results demonstrated that the lysine sources do not affect apparent total tract digestibility (ATTD) of S. The ATTD of S were 74.19 and 71.79 percent for pigs fed L-Lys HCl and L-Lys sulfate, respectively (P = 0.234). Likewise, DM digestibility of diets was not affected by lysine sources, 85.66 and 85.18 percent for pigs fed L-Lys HCl and L-Lys sulfate, respectively (P = 0.471).
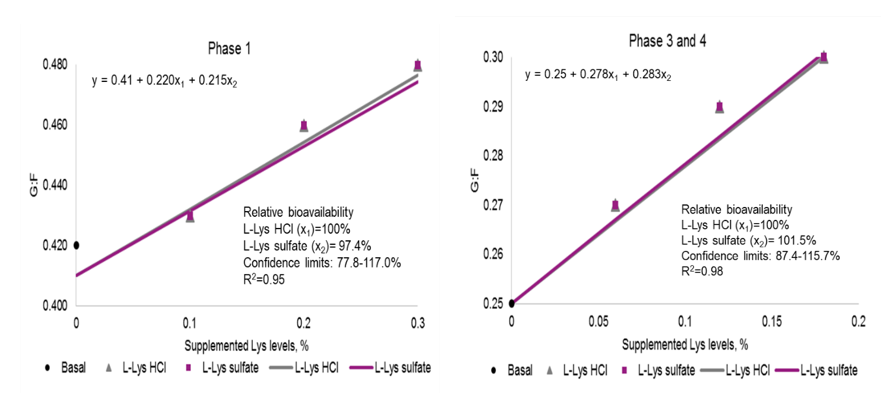
Bioavailability of L-Lys sulfate relative to L-Lys HCl were estimated based upon ADG and G:F. For purpose of illustration only RBV based upon G:F are shown in Figures 1. During phase 1, the RBV were 109.7 percent (95 percent Confidence interval (CI): 59.9-159.4 percent) and 97.4 percent (95 percent CI: 77.8-117.0 percent) for ADG and G:F, respectively. During phase 3 to 4, the RBV were 111.7 percent (95 percent CI: 36.3-187.2 percent) and 101.5 percent (95 percent CI: 87.4, 115.7 percent) for ADG and G:F, respectively. The 95 percent CI included 100 percent suggesting that bioavailability of L-Lys sulfate and L-Lys HCl do not differ. The results of the present trial agree with Liu et al., 2007; Htoo et al., 2016; and Palencia et al., 2018 which reported RBV values near 100 or slightly above.
Summary of Conclusions
- The content of sulfur in L-Lys sulfate does not affect sulfur digestibility compared to L-Lys HCl.
- Growth performance was not different for growing pigs (BW 25 to 45 kg) and finishing pigs (BW 66 to 116 kg) fed diets supplemented with L-Lys sulfate or L-Lys HCl.
- Back fat thickness decreased as dietary lysine level increases. Carcass quality did not differ from pigs fed L-Lys sulfate or L-Lys HCl.
- Bioavailability of L-Lys sulfate and L-Lys HCl work equivalently in optimizing ADG and G:F in growing and finishing pigs.