Feeding and Feeder Management: Influences on Feed Efficiency
Feeder type can dramatically influence daily gain, and feeder adjustment affects both feed efficiency and growth rate, according to Bob Goodband and colleagues of Kansas State University's Applied Swine Nutrition Team. They presented this paper at the Swine Profitability Conference 2009. 3 June 2009
 10 minute read
Frequently, we focus our nutritional programmes on diet formulation and feed processing. However, the way we provide feed to pigs can be just as important for improving feed efficiency and margin over feed costs as diet formulation. Items such as the type of feeder we use or how it is adjusted can have a huge impact on profitability. As different types of feeders come and go, we need to evaluate new technology and make decisions based on data, not initial cost. Secondly, as we begin to improve our data acquisition, an important factor is making valid comparisons among different growers or production flows.
When making comparisons between different producer or grower close-out data, we need to make sure the proper adjustments are being made so we can make fair comparisons. Examples of these are adjusting for different starting and ending weights. Another example involves the recent run-up in fat price. Fat has been removed from many finishing diet regimens. Pigs fed diets without fat are going to be less efficient and therefore when making yearly or quarterly comparisons, this too needs to be taken into account.
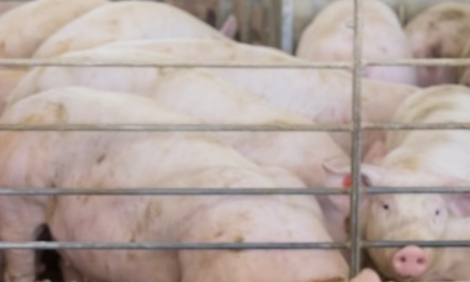
Feeder Type


Research on different types of feeders is difficult to conduct because of the expense of purchasing feeders and modifying a barn to accommodate two or more types of feeders. Recently Bergstrom et al. (2008) conducted a trial comparing a wet/dry feeder with that of a conventional dry feeder (Figures 1 and 2, respectively).
There were 46 pens with 27 pigs (PIC) per pen. The trial lasted 12 weeks. Pigs fed the wet-dry feeder had greater average daily gain (ADG) as a result of greater average daily feed intake (ADFI; Table 1). Furthermore, water usage was lower for those pigs fed with the wet/dry feeder. Frequently, producers make decisions on buying feeders based on which is the least expensive. However, in this situation, the more expensive wet/dry feeder can likely be justified by calculating the margin over feed costs for a 13-pound heavier pig.

Feeder Adjustment
Feeder adjustment also plays a huge role in improving feed efficiency. Improving wean-to-finish feed efficiency from a 2.7:1 to a 2.6:1 will save 26 pounds of feed per pig. With an average diet cost of $0.15 that is a savings of $3.90 per pig. For many years, the authors have recommended the use of feeder adjustment cards (Figure 3), in which approximately 25 per cent of the pan is covered with feed.

However with new types of feeders, this recommendation may not be correct. In fact, some have been concerned that too tight feeder adjustment may result in increased out-of-feed events and decreased average daily gain (ADG). A recent study, (Duttlinger et al., 2008) compared growth performance of pigs fed with a feeder at one of three adjustment settings. There were 1,242 pigs used with 15 replications per treatment. The trial lasted 10 weeks. Each pen was fed with a 60-inch long conventional dry feeder with five feeding spaces.

This feeder has five distinct settings (1 to 5) with 1 having the greatest gap width and 5 having the smallest gap width. Pens of pigs were randomly assigned to one of three feeder settings (1, 3 and 5) and settings were zip-tied at the beginning of the trial and not changed for the duration of the trial. Feeders with a setting of 1 (the greatest gap width) had an average of 80 per cent of the pan covered with a range of 65 to 95 per cent coverage (Figure 5). Feeder setting of 3 averaged 55 per cent of the pan covered with a range of 35 per cent to 75 per cent covered (Figure 6). Feeder setting 1 averaged 15 per cent of the pan covered with a range of 5 to 25 per cent covered (Figure 7).
Feeders were also scored daily to determine the number of plugged feeding spaces. Feeder openings 1 and 3 had no plugged feeders; however feeder setting 5 had a total of 92 plugged feeders. This represents one out of 10 feeders with a feed setting of 5 had an average of 1 feed space plugged each day. Based on these results, feeders set on setting 3 had the lowest feed and feed & facility cost per pig. Feeders set on Setting 1 had similar ADG as setting 3, but the greater feed wastage increases feed cost and feed & facility cost. Feeder setting 5 restricted ADG and thus it too increased feed and feed & facility cost.
These results suggest that for this type of dry feeder, increasing the opening to allow on average 55 per cent of the pan to be covered will not negatively influence feed efficiency or total feed cost.


Adjusting Close-Out Information
More and more producers are using nursery and/or grow-finish records to evaluate production. Perhaps one of the easiest and most common forms of growing pig record keeping is done by the use of Excel spreadsheets. Data can then be quickly summarised in pivot tables for evaluation.
However, there are important limitations when comparing large data sets taken over time or comparing results of different producers or growers within a system. For example, if one grower has a feed efficiency of 2.9:1 and a second has a 3.0:1, is the difference between the growers a true reflection of their management? One factor to include is the beginning and ending weight of the pigs. Grower 1 may have marketed his pigs at 270 lb, while grower 2 may market at 290 lb. The differences in final weight could be a greater factor affecting feed efficiency. Because of this variation, a feed efficiency adjustment factor is used. Because factors other than purely management can affect feed efficiency, feed efficiency must be adjusted for differences in beginning and ending weight and dietary factors such as adding fat, pelleting and, in some cases, grain source.
Nursery Feed Efficiency Adjustments
The data in Table 3 represents an example of adjusting nursery feed efficiency. Both nursery growers have identical feed efficiency. However, when we take into account that grower B has an 18-pound heavier pig, the adjusted feed efficiency indicates that this grower has the better feed efficiency when based on a common out weight of 55 lb.

The equation to adjust F/G to a common end point (55 lb) in this example is:
Actual F/G - 0.008*(weight out – 55 lb)
Finishing Feed Efficiency Adjustments
Several factors impact finisher feed efficiency. Expected feed efficiency will be influenced by the entry weight and market weight of the pigs, energy level of the diet, and whether or not the diets are pelleted. In order to compare feed efficiency among groups, adjustment factors for these major items must be used. Adjustment factors have been developed for entry weight and market weight of the pigs, energy level of the diet, and whether the diets are in pellet or meal form. Therefore, variation among close outs can be accounted for by these factors and may aid in detecting differences among groups for other factors, such as feed wastage.
An example of the importance of adjusting finisher feed efficiency is represented in Table 4. THe authors show five different growers within a production system. Market weights range from 272 to 264 lb. Average daily gain appears to be consistent among the growers with the exception of grower 4, which also had the highest mortality. Feed efficiency appears to be relatively similar with growers 1 and 3 having the best feed to gain ratio (F/G) followed by growers 2 and 4, and lastly grower 5. But overall the differences between the five growers are relatively small. However, F/G is adjusted for in- and out-weight, grower 1 has the best F/G by a wide margin.

The following equation can be used to compare different groups with different ending weights and market weights:
Adjusted F/G = observed F/G + (50 – entry wt ) × .005 + (250 – market wt) × .005
This equation adjusts all groups to a common entry weight of 50 pounds and market weight of 250 pounds. Further adjustments can be made to compare groups with different grain sources, dietary energy levels and pelleted or meal diets. The adjustment for energy level uses an adjustment for grain source and fat level in the diet (grain factor – (fat level × 2)), where the grain factor is 1 for corn and fat level is the per cent fat in the diet. The adjustment for pelleting is (1– pellet factor), where the pellet factor is the percentage improvement in feed efficiency due to pelleting (generally 4 to 6 per cent).
The factors can be included in one formula to compare all of the factors at the same time:

Calculating Opportunity Costs
Now that feed efficiency has been standardised to a common 50 to 250 lb basis, the opportunity values can be calculated between the growers. An opportunity value is the dollars that could be saved if a grower could improve the feed efficiency (or mortality and average daily gain, and medication costs) to the best value for the group of growers. For example, the growers in Table 4, we can calculate opportunity values for feed efficiency, average daily gain, mortality and medication costs. The respective equations are:
Feed Efficiency
Observed F/G – the best F/G × (weight out – weight in) × (feed cost per lb of gain/F/G)
Mortality
(Observed mortality – the lowest mortality) × (out weight × market price)
Medication costs
Observed medication cost – lowest medication cost
Average Daily Gain
IF (final wt > 275,0,(275-final wt) × (market value- feed cost/lb gain))
The values in the chart represent a $0.50 lb market value and an ideal market weight of 275 lb.
To interpret the data, the chart shows grower 1 having the best F/G. (There is no F/G bar for grower 1.) Growers, 2, 3, 4 and 5 could save approximately $3.00, $2.50, $3.00 and $2.75 per pig, respectively, if they improved their feed efficiency to that of the best grower, 1.

For mortality, growers 2 and 3 have the same mortality, which happens to be the best among the group. Growers 1, 4 and 5 could save approximately $1.80, $2.00 and $0.25 per pig, respectively, if they could lower their mortality to that of growers 2 and 3. For ADG, all growers are marketing pigs below the ideal weight range for this specific packer (275 lb). The equation yields the margin over feed cost (market value - feed cost per lb of gain) times the weight difference between the actual market weight and 275 lb. For growers 1, 2, 3, 4 and 5, these values are approximately $0.25, $1.00, $1.50, $1.00 and $0.50, respectively.
Lastly, with medication costs, grower 2 has the lowest medication cost per pig. Growers 1, 3, 4 and 5 could save approximately $0.50, $1.10, $1.00 and $0.75, respectively.
So not only can we compare among different growers with equalised feed efficiency, we can also determine the value a grower has to equal the best specific trait in that groups of growers.
In conclusion, there are several non-feed factors that play an important role in improving pig performance. It appears that feeder type can dramatically influence daily gain. Feeder adjustment also influences not only feed efficiency but growth rate as well. Lastly, when comparing production values of different growers, it is possible to standardise feed efficiency to make fair comparisons between growers or production systems. We can then calculate economic differences of production traits to determine producer incentive to improve.
Further Reading
| - | You can view other papers presented at Swine Profitability Conference 2009 by clicking here. |
June 2009