

Improving Key Performance Indicators: Breeding Herd KPIs
Knowing how your breeding herd performs helps you to identify where and how to concentrate your time, effort and investment to improve performance and reduce the cost of production, according to BPEX in its recently updated 'Action for Productivity' No. 26.Achieving a consistent flow of sows and litters through the farrowing and
subsequent departments is paramount to the smooth operation of the unit.
It is important to keep the cost of producing piglets to a minimum to enable
you to maximise profitability at sale. Knowing how your breeding herd
performs helps you to identify where and how to concentrate your time,
effort and investment to improve performance and reduce the cost of
production.
Keeping track of changes in performance over time means
you learn what works for your unit, in terms of herd management
and environment, motivating you and the team to
do more of this. It also provides early warning if performance
starts to deteriorate.
Farrowing Rate
- The farrowing rate tells you the number of sows that farrow as a percentage of the number of sows and gilts that are served.
- A farrowing rate of 85 per cent means that for every 100 sows and gilts served, 85 have gone on to farrow, while the remaining 15 have either returned, been culled or died.
- To calculate farrowing rate, keep a record of all sows and gilts served and all farrowings over a 12-month period. Divide the number of sows farrowed over 12 months by the number of sows and gilts served and multiply the answer by 100.
- You can track changes each month by deleting data from the earliest month and adding data from the latest month.
Farrowing rate can then be compared with industry averages.

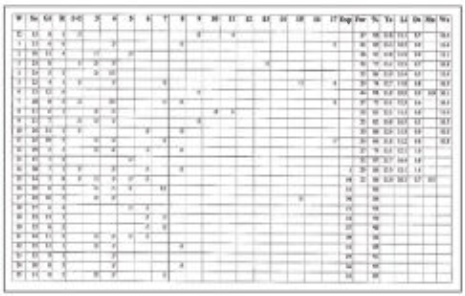
- For a 'real-time' farrowing rate record, draw up a fertility chart and record weekly services, subsequent failures and expected farrowing rate percentages.
- High numbers of returns, irregular returns and late returns are then recorded and monitored weekly and quick corrective action can be taken as required.
- A low farrowing rate indicates a need to improve herd management:
- Sow and gilt management – stable body condition, social environment, etc.
- Nutrition and feeding regimes
- Stockmanship, including heat observation and recording, service/AI management and handling techniques
- Physical environment, including the thermal environment and hygiene
- Timeliness of decisions regarding culling sows.
- Farrowing rate provides a guide to how many sows you need to serve to run the farrowing accommodation at optimum capacity, which is key to achieving competitive financial performance
- One less farrowing from target per week equates to a loss of 546 less pigs weaned per year, demonstrating the importance of not having empty farrowing crates
- If the farrowing accommodation provides capacity for 16 sows to farrow each week and the farrowing rate is 85 per cent, you need to serve 19 sows to fill each farrowing room each week. However, if the farrowing rate falls to 75 per cent, you need to increase services to 21 sows and gilts per week
- Some managers routinely serve higher than the number theoretically required to ensure a full farrowing house; excess sows are then culled once the batch has been confirmed in-pig
- You need to think through the implications of any new practices carefully. For example, you need to make sure that any increase in sows served (to overcome a low farrowing rate) does not lead to overcrowding of the sow accommodation
- You also need to be aware of costs: extra feed, AI, straw and labour. Each extra sow served and housed through to seven weeks post service is approximately £50 per sow. If, on a 350-sow herd, an additional 15 per cent of sows are served each week (approximately two to three), the additional cost would be around £6,000 per year.
Farrowing Index
Farrowing index, also referred to as litters per sow per year, tells us the average number of times sows farrow in a year. The average farrowing index for UK herds is 2.25, the best herds achieve nearer 2.39. Examples of the effect different farrowing indexes have on herd production:
- 350 sows with a farrowing index of 2.25, weaning 10.5 pigs, wean a total of 8,269 pigs per year
- Improving the farrowing index to 2.39 would wean an additional 514 pigs per year (a six per cent increase)
- Alternatively, you could wean 8,269 pigs from just 329 sows (six per cent fewer sows), taking pressure off the service and dry sow accommodation and reducing dry sow feed, variable and labour costs.
Farrowing rate can then be compared with industry averages, see below.
Computerised individual and herd recording will provide regular updates on farrowing index. In the absence of a computerised system you can get a broad idea of farrowing index by completing Table 1.


Once you have your first 12-months’ data, you can track changes each month by deleting data from the earliest month and adding data from the latest month.
Farrowing index is determined by four key factors:
- length of pregnancy (usually 115 but can be as high as 117 days)
- length of lactation (typically 26 to 27 days)
- typical number of days healthy sows take to come into heat following weaning (target: five days) and
- non-productive days.
There is little you can do to change the first two – other than making a radical change to your system, e.g. weaning age or herd genetics.
Non-productive Days
To improve your farrowing index, concentrate on non-productive days. These can be caused by:
- Delayed heat after weaning – perhaps because the sow is in poor condition, or housing design does not give weaned sows good exposure to the boar
- Sows missing a service – which might be due to poor heat observation or sows coming into heat in the farrowing house
- Sows returning – potentially due to timing of service or an inadequate environment
- Delayed returns – these are late returns or returns which go undetected until the seven-week scan or even further into the planned pregnancy
- Sows culled or dying during pregnancy, e.g. due to lameness.
In recording terms, 'non-productive days' can also increase due to constructive management decisions taken to
improve herd productivity and/or resource utilisation. For example, using nurse sows (either intended cull sows or extending the lactation of a breeding sow) or over-serving to ensure full utilisation of the farrowing house, with excess sows culled once pregnancy is confirmed. It is important to understand the impact of these on your farrowing index.
To improve farrowing index, you first need to investigate reasons for non-productive days and determine what you can do to reduce these. An individual sow recording system will provide the most accurate measure of total non-productive days and will highlight where these are
occurring. In the absence of an individual or whole herd recording system, complete Table 2 to provide an idea of lost days on your unit and how your herd compares with industry averages.
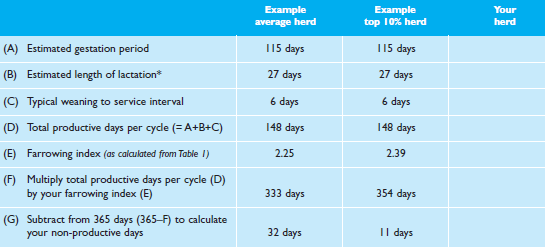
* Note: the legal minimum weaning age is 28 days, however, under certain conditions, such as adoption of rigorous biosecurity measures, piglets may be weaned at a younger age.
To explore the situation further, you will need to keep a record of what is happening with individual sows. Here is an idea of how individual factors can impact on lost days based on annual production from 100 sows.

Summary
- Farrowing rate, farrowing index and non-productive days are all interconnected. Actions you take to improve farrowing rate have the potential to also reduce non-productive days and improve farrowing index.
- To improve sow performance, identify where there is greatest potential for improvement on your unit by comparing your performance with industry data; set yourself achievable targets and then determine the most cost-effective ways to achieve these targets.
- Detailed financial data for the unit will enable you to go one stage further in prioritising between alternative management changes, with a 'what if' assessment, enabling you to assess the financial benefits of improving performance on your unit
- On-going recording of sow performance will tell you how successful the measures you are taking are and provide encouragement to you and your team to do more of the same.
March 2013


