Management of Weaned Pigs 1: Increasing group size
by Niamh E. O'Connell, Violet E. Beattie and R. Norman Weatherup - Increasing the group size of weaned pigs has potential benefits for producers in terms of more efficient use of resources and greater ease of management. There are concerns however about the effects of increasing group size on productivity and welfare. The aim of this study was to assess the effect of increasing group size on the performance and behaviour of weaned pigs in commercial housing. 28 April 2002
 14 minute read

General introduction
Rearing weaned pigs involves a balance between achieving optimum performance while minimising costs. Achieving high feed intake is central to obtaining optimum performance in weaned pigs, and efficient food conversion is central to minimising costs. Newly-weaned pigs often show low levels of feed intake during the post weaning period, this may reflect difficulty adapting to a solid diet and to using a feeder for the first time (Pluske and Williams 1996). In addition, stress associated with separation from dam and littermates, mixing with unfamiliar animals and relocation to a new environment may contribute to reduced feed intake.As a consequence there is usually a 'growth check' post weaning, where growth rates can fall from 300 g/day in the week prior to weaning to 100 g/day in the week after weaning. This growth check represents a major production penalty for a number of reasons. Firstly, growth rate in the immediate post weaning period has been shown to affect lifetime performance and even carcase quality (Hutton, 1989). In addition, poor growth rates can extend the amount of time pigs spend in expensive weaner accommodation and can also reduce physiological development. As a result pigs are more susceptible to disease (Partridge, 1989).
The way in which pigs are managed in the post weaning period largely determines performance and cost of production within a given breed. There are a number of factors to be considered, including weaning age, ambient temperature, stocking rate, group size, mixing strategy, feeding regime, and pen and feeder design. The onus is on the manager to manipulate these factors in order to maximise production efficiency. It is becoming increasingly necessary to achieve this while minimising labour and capital expenditure.
The research discussed in this paper involves investigations into two areas of management of weaned pigs: Increasing group size (this article), and Providing additional wet feed. The overall objective is to investigate methods of improving production efficiency in weaned pigs.
This article focuses on the first of these two investigations:
| Increasing group size of weaners |
Introduction
Increasing the group size of weaned pigs has potential benefits for producers in terms of more efficient use of resources and greater ease of management. There are concerns however about the effects of increasing group size on productivity and welfare. Previous studies have yielded conflicting results, with some researchers reporting reduced productivity and increased aggression when group size is increased (Spoolder et al., 1999), and others finding no effect on productivity and reduced aggression when group size is increased (Nielsen et al., 1995). A key concern with large groups is the welfare of smaller pigs, which may have difficulty gaining access to resources such as the feeder. However, the greater choice of feeding spaces in larger groups and the increase in available or free space (McGlone and Newby, 1994) may benefit small pigs in particular by allowing them to escape from, and feed away from, larger animals.The aim of study 1 was to assess the effect of increasing group size, up to sixty pigs per group, on the performance and behaviour of weaned pigs in commercial housing. The effect of group size on small, medium and large animals in particular was assessed.
Material and methods
Pre-experimental treatmentPiglets were born in crated farrowing accommodation and were offered a commercially available creep feed from 10 days of age in a forward creep area. Piglets were weaned at 4 weeks of age and allocated to treatments.
Treatments
Piglets were assigned to groups of 10, 20, 30, 40 or 60 pigs at weaning. All groups were balanced for gender and weight, and were randomised over litters. The experiment was carried out over eight replicates.
Animals and housing
A total of 1280 pigs were used in this experiment. The pigs were weaned at 4 weeks of age at an average weight of 9.7 kg and assigned to treatments. The pigs were retained in their respective treatment groups throughout stage 1 (4 to 7 weeks of age) and stage 2 (8 to 10 weeks of age).
The pigs were housed in combined stage 1/stage 2 accommodation with plastic slatted floors, thermostatically controlled ventilation and a space allowance of 0.38 m2 per pig. All pens were rectangular in shape and 2.5 m long from front to back. The width of the pens was 1.5, 3, 4.5, 6 and 9 m wide for groups of 10, 20, 30, 40 and 60 pigs, respectively. Figure 1 shows the layout of a pen for a group of 10 pigs and for a group of 60 pigs. The pigs were provided with one dry four-space feeder and one drinking bowl per ten pigs.

Figure 1:
Shape and layout of pens for housing groups of 10 and 60 pigs (* = feeder)
Diets offered between 4 and 7 weeks of age consisted of commercial starter and stage 1 feeds in pelleted form. From 8 to 10 weeks of age the pigs were offered a pelleted cereal/soya based diet ad libitum. This contained 14.2 MJ DE/kg and 22% crude protein and was manufactured at the Agricultural Research Institute of Northern Ireland.
Parameters measured
Pigs were individually weighed at 4, 7 and 10 weeks of age and feed intake was recorded weekly. Individual growth rates and group feed intake and feed conversion ratios were calculated for stage 1 (4 to 7 weeks of age) and stage 2 (8 to 10 weeks of age).
All pigs in each group were ranked by weaning weight and arbitrarily divided into three categories, small, medium and large, and marked accordingly on their backs. The average weaning weight of small, medium and large pigs was 8.2, 9.6 and 11.4 kg, respectively. The performance of these pigs was assessed throughout stages 1 and 2.
The pigs were ranked again on the basis of their 10 week weight and arbitrarily divided into small, medium and large categories. The average difference in weight between small and large pigs within each group was used to calculate within-group variation in weight.
Behaviour at the feeder was videotaped for continual 24 hour periods when the pigs were 5, 7 and 9 weeks of age. The feeder which was recorded was chosen in a predetermined order at each observation. Video tapes were analysed to determine the number of small, medium and large pigs at the feeder at 20 minute intervals. The frequency of fights, headthrusts and displacements from the feeder were also recorded for 30 seconds at each sampling interval.
Results and Discussion
MortalityThere were no significant differences in mortality across treatments with the average mortality rate being 0.5%. There were no deaths recorded in groups of 10 or 20 pigs and the mortality rate was 0.4% in groups of 30 pigs, 1.6% in groups of 40 pigs and 0.6% in groups of 60 pigs.
Production performance
The average weight of the pigs at the end of stage 1 was 16.7 kg and at the end of stage 2 was 31.8 kg. There were no significant treatment differences in live weight at 4, 7 or 10 weeks of age (Table 1).
Table 1: Mean live weight (kg) at 4, 7 and 10 weeks of age (live weight at 7 and 10 weeks of age calculated using 4 week weight as a covariate) |
|||||||
| Group size | |||||||
| Age | 10 | 20 | 30 | 40 | 60 | s.e.m. | P |
| 4 weeks | 10.2 | 9.7 | 9.4 | 9.7 | 9.6 | 0.30 | NS |
| 7 weeks | 16.8 | 16.8 | 16.2 | 17.0 | 16.7 | 0.29 | NS |
| 10 weeks | 32.0 | 31.8 | 31.2 | 32.0 | 31.9 | 0.57 | NS |
The influence of group size on mean production performance is given in Table 2. Group size did not have a significant effect on mean growth rate of the group during stage 1 (4 to 7 weeks), stage 2 (8 to 10 weeks) or stages 1 and 2 combined (4 to 10 weeks). This agrees with previous studies which assessed the effects of increasing group size up to a maximum of 30 pigs (Randolph et al., 1981; Walker, 1991). Feed intake did not differ between treatments, however the food conversion ratio tended to be better in groups of 10 and 20 pigs than in larger group sizes during stage 2 (P<0.1). Although this 10% deterioration in food conversion in larger groups was not significant, it is equivalent to approximately 76 p/pig sold. This deterioration was due to regular fouling of one feeder per group in the larger groups. This did not influence overall food conversion for stages 1 and 2, which was similar across treatments.
Table 2: Mean feed intake and performance during stage 1 (4 to 7 weeks), stage 2 (8 to 10 weeks) and stages 1 and 2 combined (4 to 10 weeks) using weaning weight as a covariate |
|||||||
| Group size | |||||||
| Age | 10 | 20 | 30 | 40 | 60 | s.e.m. | P |
| Daily feed intake (g/d) | |||||||
| Stage 1 | 429 | 405 | 433 | 441 | 439 | 29.5 | NS |
| Stage 2 | 1111 | 1086 | 1143 | 1106 | 1177 | 55.6 | NS |
| Stages 1 and 2 | 770 | 746 | 788 | 774 | 808 | 38.9 | NS |
| Daily liveweight gain (g) | |||||||
| Stage 1 | 352 | 354 | 325 | 366 | 347 | 13.9 | NS |
| Stage 2 | 725 | 717 | 714 | 714 | 723 | 17.0 | NS |
| Stages 1 and 2 | 543 | 540 | 524 | 544 | 540 | 13.7 | NS |
| Food conversion ratio | |||||||
| Stage 1 | 1.22 | 1.19 | 1.36 | 1.26 | 1.30 | 0.063 | NS |
| Stage 2 | 1.57 | 1.67 | 1.78 | 1.77 | 1.84 | 0.063 | <0.1 |
| Stages 1 and 2 | 1.42 | 1.43 | 1.50 | 1.51 | 1.52 | 0.039 | NS |
Pigs which were in the smallest third of the group at weaning showed lower growth rates in groups of ten than in bigger group sizes (Table 3). This was particularly apparent during stage 1 when growth rates of small pigs in groups of ten were over 100 g/day lower than the average growth rate of small pigs in other group sizes (P&0.1). During stage 2 the growth rate of small pigs in groups of ten was 50 g/day lower than the average growth rate of small pigs in all other group sizes, however this difference was not significant. The growth rate of large pigs in groups of ten was 29 g/day higher than the average growth rate of large pigs in other group sizes during stage 1, and 23 g/day higher than the average growth rate of large pigs in other group sizes during stage 2. These differences did not reach statistical significance.
Table 3 Daily liveweight gain (g) of small, medium and large pigs during stage 1 (4 to 7 weeks), stage 2 (8 to 10 weeks) and stages 1 and 2 combined (4 to 10 weeks) using weaning weight as a covariate |
|||||||
| Group size | |||||||
| Age | 10 | 20 | 30 | 40 | 60 | s.e.m. | P |
| Small | |||||||
| Stage 1 | 268 | 338 | 329 | 331 | 339 | 19.3 | &0.1 |
| Stage 2 | 632 | 667 | 694 | 685 | 681 | 25.2 | NS |
| Stages 1 and 2 | 449 | 510 | 517 | 515 | 513 | 20.2 | NS |
| Medium | |||||||
| Stage 1 | 383 | 343 | 319 | 372 | 345 | 23.4 | NS |
| Stage 2 | 760 | 716 | 708 | 712 | 720 | 14.4 | NS |
| Stages 1 and 2 | 577 | 540 | 519 | 546 | 536 | 16.8 | NS |
| Large | |||||||
| Stage 1 | 409 | 371 | 324 | 390 | 357 | 21.5 | NS |
| Stage 2 | 777 | 768 | 740 | 736 | 770 | 21.7 | NS |
| Stages 1 and 2 | 598 | 566 | 537 | 564 | 571 | 18.4 | NS |
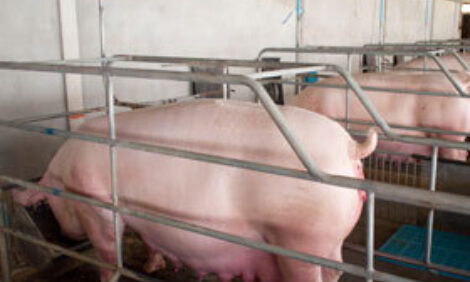
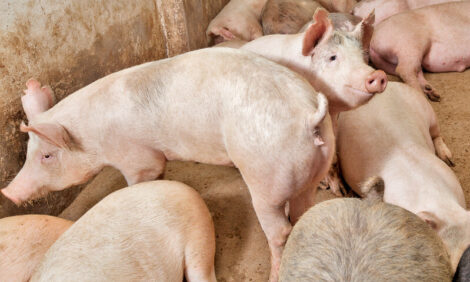
These results show that the performance of small pigs was poorer in groups of ten animals, especially during stage 1, than in other group sizes. A possible explanation for this was that the pigs only had access to one feeder in groups of ten whereas in bigger groups there was a choice of feeders (Plate 1). This may have meant that in groups of ten, large pigs gained priority access to the feeder to the disadvantage of small pigs. This problem may have been exacerbated by the decrease in available or 'free' space in smaller groups (McGlone and Newby, 1994), which may have meant more pigs lying or standing in front of the feeder (Plate 2).
Walker (1995) introduced the term 'social workload' which referred to the 'effort required and aggression encountered in negotiating a route through pen mates to a feeder and dislodging pigs which are either feeding or obstructing the feeder'. The results from the present study suggest that the 'social workload' involved in getting to the feeder may have been higher for small pigs in groups of ten than for small pigs in bigger groups.
Within-group weight variation
On average across all replicates and all treatments, 57% of pigs which were in the small category at weaning at 4 weeks of age were also in the small category at 10 weeks of age, and 60% of pigs which were in the large category at weaning were also in this category at 10 weeks of age. As a result of the differences in growth rate between small and large pigs, within-group variation in weight at 10 weeks of age was approximately 3 kg greater in groups of ten animals than in bigger groups (P&0.01) (Figure 2).
 |
Figure 2: Difference in liveweight between the smallest and largest third of pigs in groups of different sizes at 10 weeks of age (bars with different superscripts are significantly different, P&0.01) |
This increase in weight variation in groups of ten pigs may have implications when the animals reach slaughter weight. Previous research at this Institute has shown that a 3 kg spread at the end of stage 2 resulted in a 15 kg spread at slaughter (O'Connell et al., 1999). If this increase in differential is applied to the present study the variation in pigs would be substantially greater at slaughter weight in groups of ten pigs than in bigger groups. This greater variation could result in a less efficient use of finishing accommodation if pigs are slaughtered weekly at a target slaughter weight.
 Choice of feeders in large groups |
 Blocking the feeder in small groups |
Analysis of diurnal patterns of behaviour showed two peaks in feeding behaviour, a smaller one in the morning and a larger one in the afternoon (Figure 3). These peaks in feeding behaviour have been described previously in pigs (Morrow and Walker, 1994; Nielsen et al., 1995), and are thought to be related to stockman activity (Morrow and Walker, 1994). In the present study, pigs which were housed in groups of 40 or 60 showed lower levels of feeder occupancy during the period between these two peaks than pigs in smaller groups.
This reduction in feeder occupancy may suggest lower levels of competition for feeding spaces in bigger groups (Walker, 1991). This corresponds with earlier findings in this study that the lowest levels of within-group weight variation were also shown in the larger group sizes. The apparent increase in demand for the feeder in smaller groups was not accompanied by an increase in aggressive behaviour at the feeder (Table 5).

Figure 3:
Patterns of feeder usage by pigs in different group
sizes between 4 and 10 weeks of age
Table 5: Average incidence of aggressive behaviour at the feeder over a 24 hour period by pigs between 4 and 10 weeks of age |
|||||||
| Parameter | Group size | ||||||
| Age | 10 | 20 | 30 | 40 | 60 | s.e.m. | P |
| Headthrusts | 0.13 | 0.10 | 0.00 | 0.14 | 0.04 | 0.055 | NS |
| Fights | 0.01 | 0.01 | 0.00 | 0.01 | 0.00 | 0.006 | NS |
| Displacements | 0.03 | 0.03 | 0.01 | 0.04 | 0.02 | 0.011 | NS |
Management
At least one feeder was regularly fouled in groups of both 40 and 60 animals and had to be cleaned out by hand. Therefore it may be possible to remove one of the feeders in these larger groups without affecting productivity. The lack of choice of feeders in groups of ten animals meant that if the feeder became fouled or blocked then animals had no access to feed until it was cleared.
It may be possible to increase the number of pigs per drinker when group size is increased to more than ten animals. This is because two separately plumbed drinkers are required by legislation for every group of pigs. Therefore two drinkers per ten pigs are required for a group of ten pigs whereas only one drinker per ten pigs is required for groups of 20 or more pigs.
In addition to possible reductions in capital expenditure on feeders and drinkers in larger groups, there is also reductions in expenditure on dividing walls. The lack of dividing walls in larger groups may also create extra housing capacity. A 0.1 x 2.5 m dividing wall occupies the space allowance of 1.3 stage 1 pigs (at a space allowance of 0.2 m2 per pig).
Conclusions
- Increasing group size from 10 to 60 animals had no significant adverse effects on performance or welfare as measured by aggression at the feeder.
- Feed wastage was higher in larger groups however it may be possible to reduce this by removing one of the feeders.
- There were benefits in increasing group size to more than ten animals in terms of reduced within-group weight variation and reduced capital expenditure.
General summary for management of weaned pigs
General summary for management of weaned pigs |
||
| Increasing group size | Providing additional wet feed | |
| Stage 1 growth | no effect | no effect |
| Stage 1 food conversion ratio | no effect | poorer |
| Stage 2 growth | no effect | no effect |
| Stage 2 food conversion ratio | poorer | no effect |
| Variability in groups | reduced | no effect |
| Capital expenditure | reduced | increased |
| Labour | no effect | increased |
| Production efficiency | Improved | Reduced |